Codethink is working on a project to design a fully open-source (hardware and software) research device for experimenting with shining light into skin and detecting the light that reflects, gets absorbed and passes through. This kind of technology is widely deployed for measuring heart rates.
Existing technology used in smart watches suffers various shortcomings, such as reduced effectiveness on darker skin tones and tattoos.
This project aims to develop a research testbed that can be used to find alternatives that won’t have the same drawbacks. Our testbed enables multiple LEDs of different wavelengths (colours of light) distributed through the visible and infra-red to be used to uncover other interesting metrics that may be detectable, such as:
-
Hydration
-
Blood sugar levels
-
Carbon Monoxide levels
Background
Pulse oximeters currently use 2 wavelengths of red/infra-red light to determine blood oxygen levels through a process called photoplethysmography (PPG).
Smart watches and fitness trackers use a simpler mechanism to determine pulse rate. This is done by reading the variations in light reflected by the wearer’s blood using a green LED at a fixed wavelength. This allows a cheaper, lower power but lower accuracy mechanism for reading pulse rate: It also doesn't work as well on darker skin or tattoos.
Summary
Our device has the red/infra-red LEDs used by medical pulse oximeters, and the green LED used by smart watches. These can be used to reproduce existing results. We also have a range of wavelengths distributed between 470nm and 1650nm (blue to short-wave infra-red).
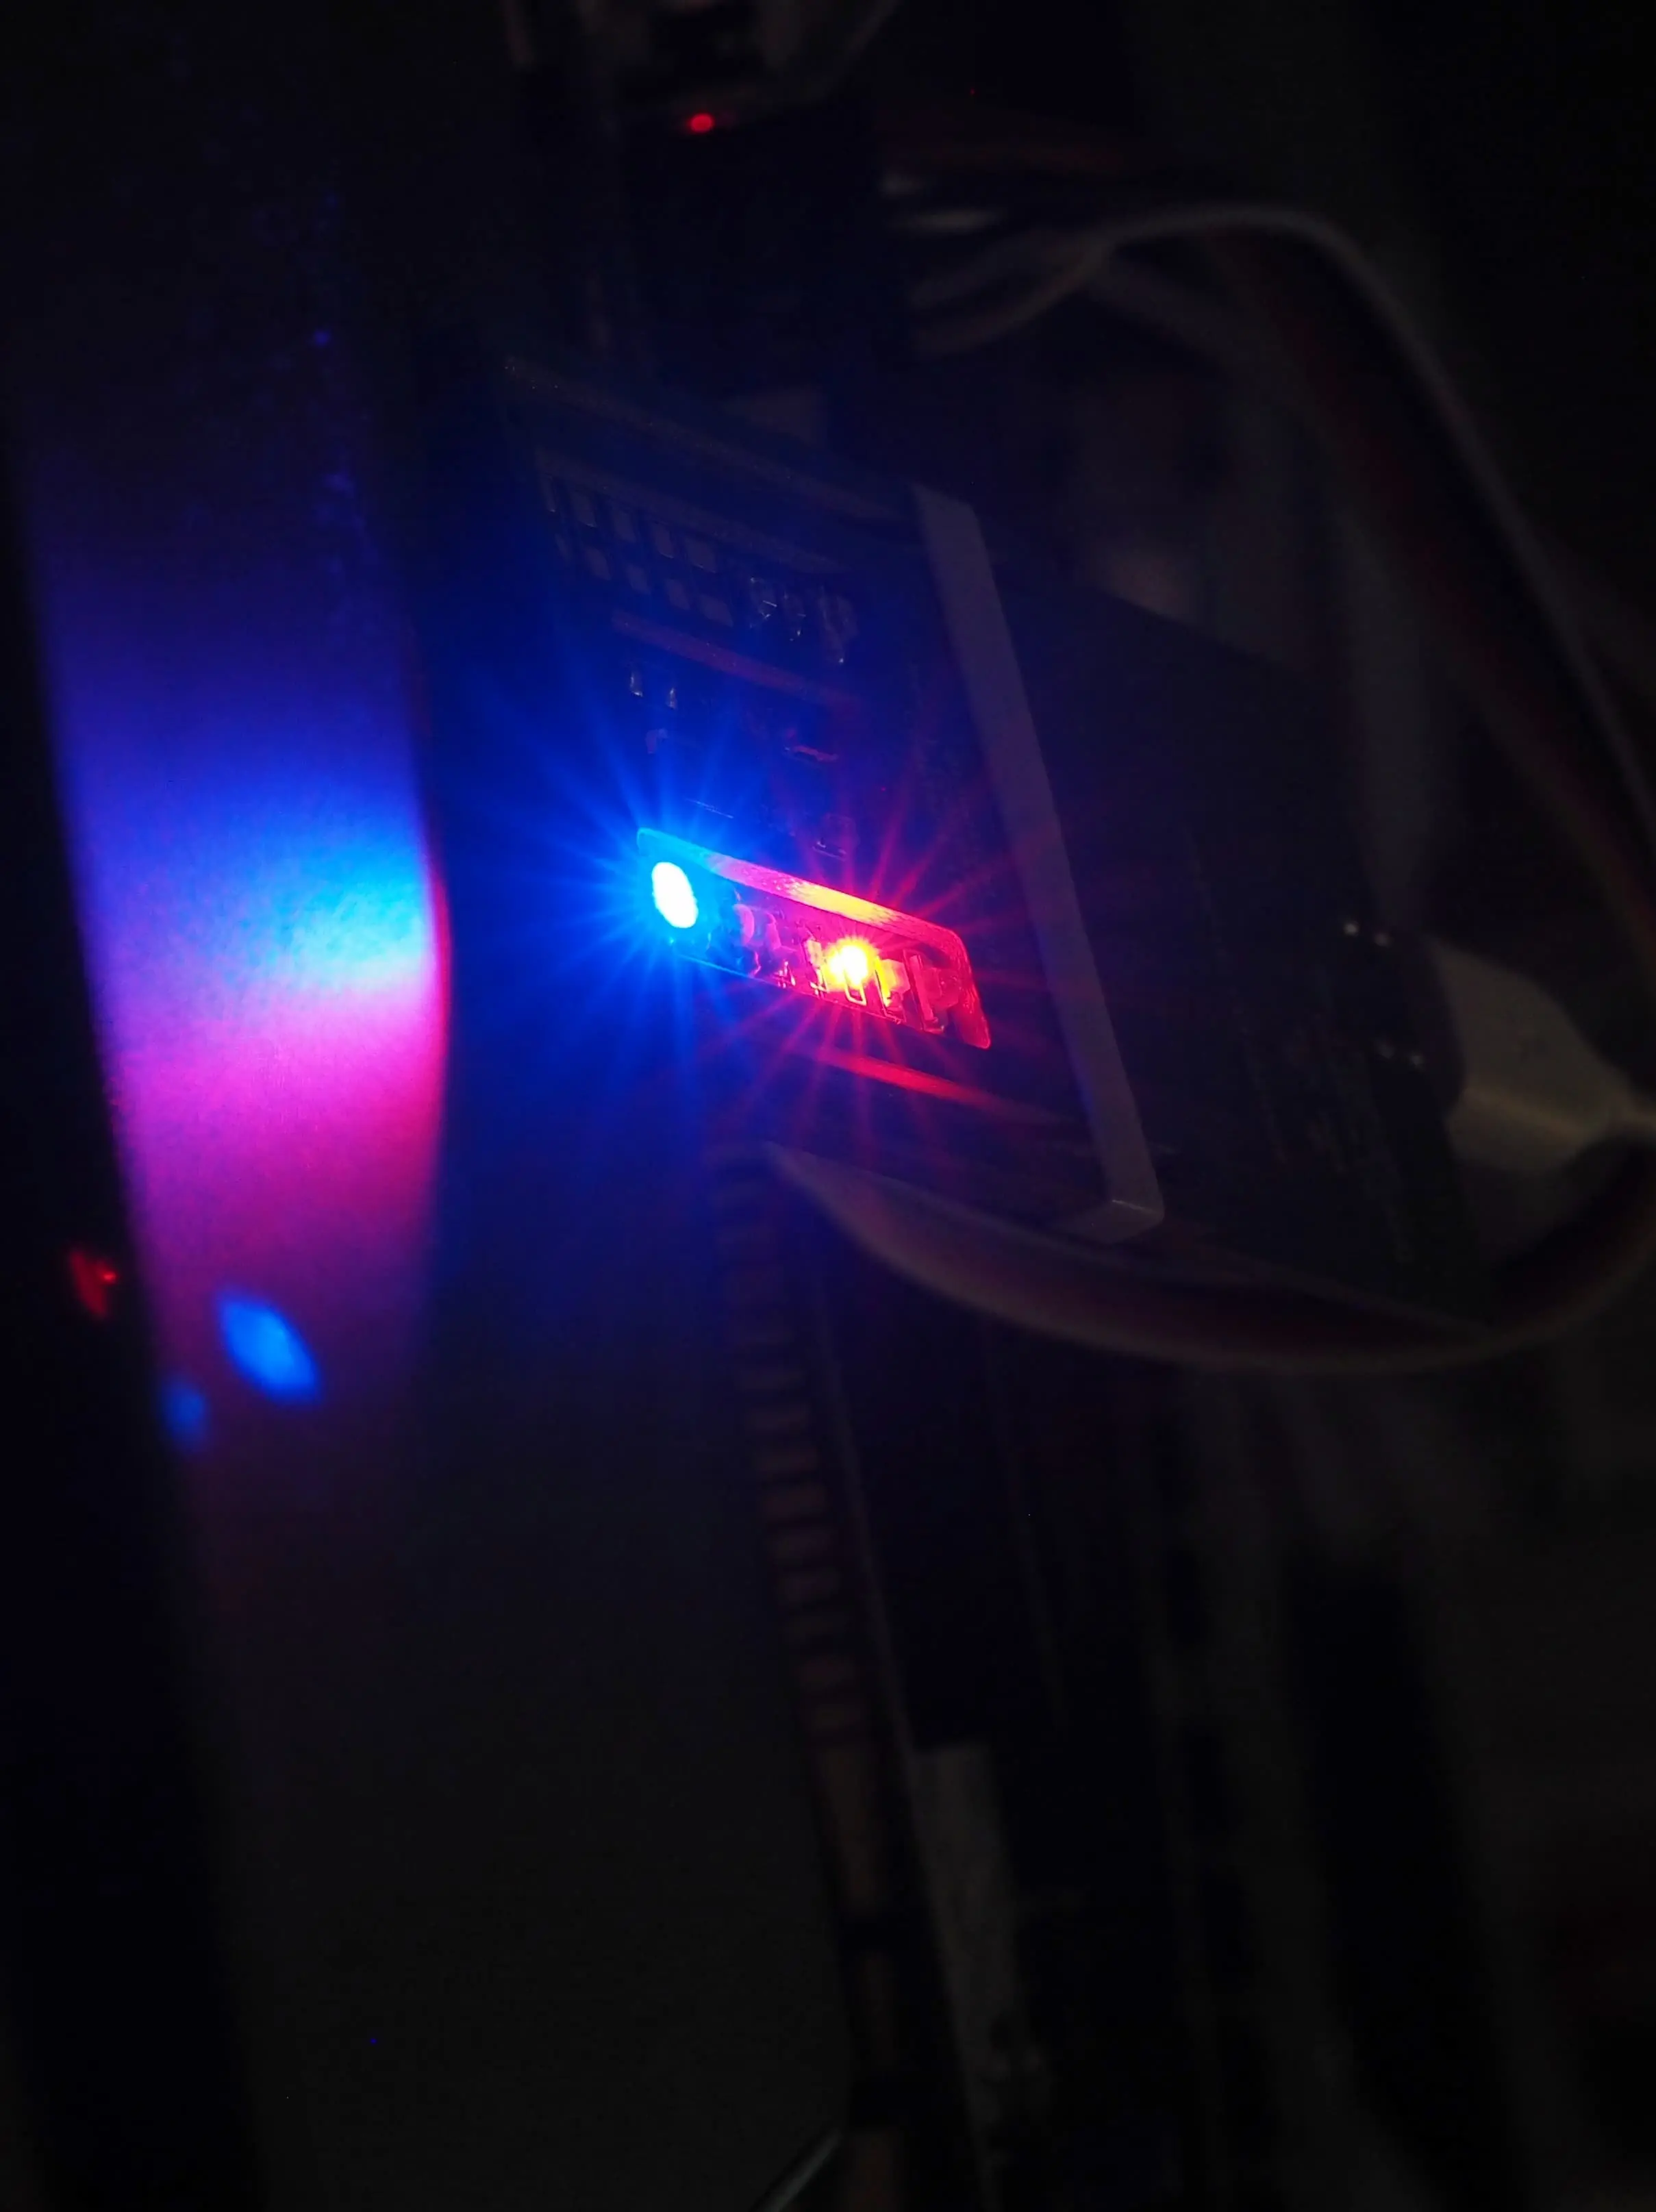
At this early stage, we have used a first prototype board and seen a pulse in the data from reflection with the green LED.
The work has been released in the open. It provides a base for others to be able to take the work and be able to apply it in different settings or develop it further. In its current state, it is possible to capture data in various wavelengths, enabling various kinds of data science experimentation.
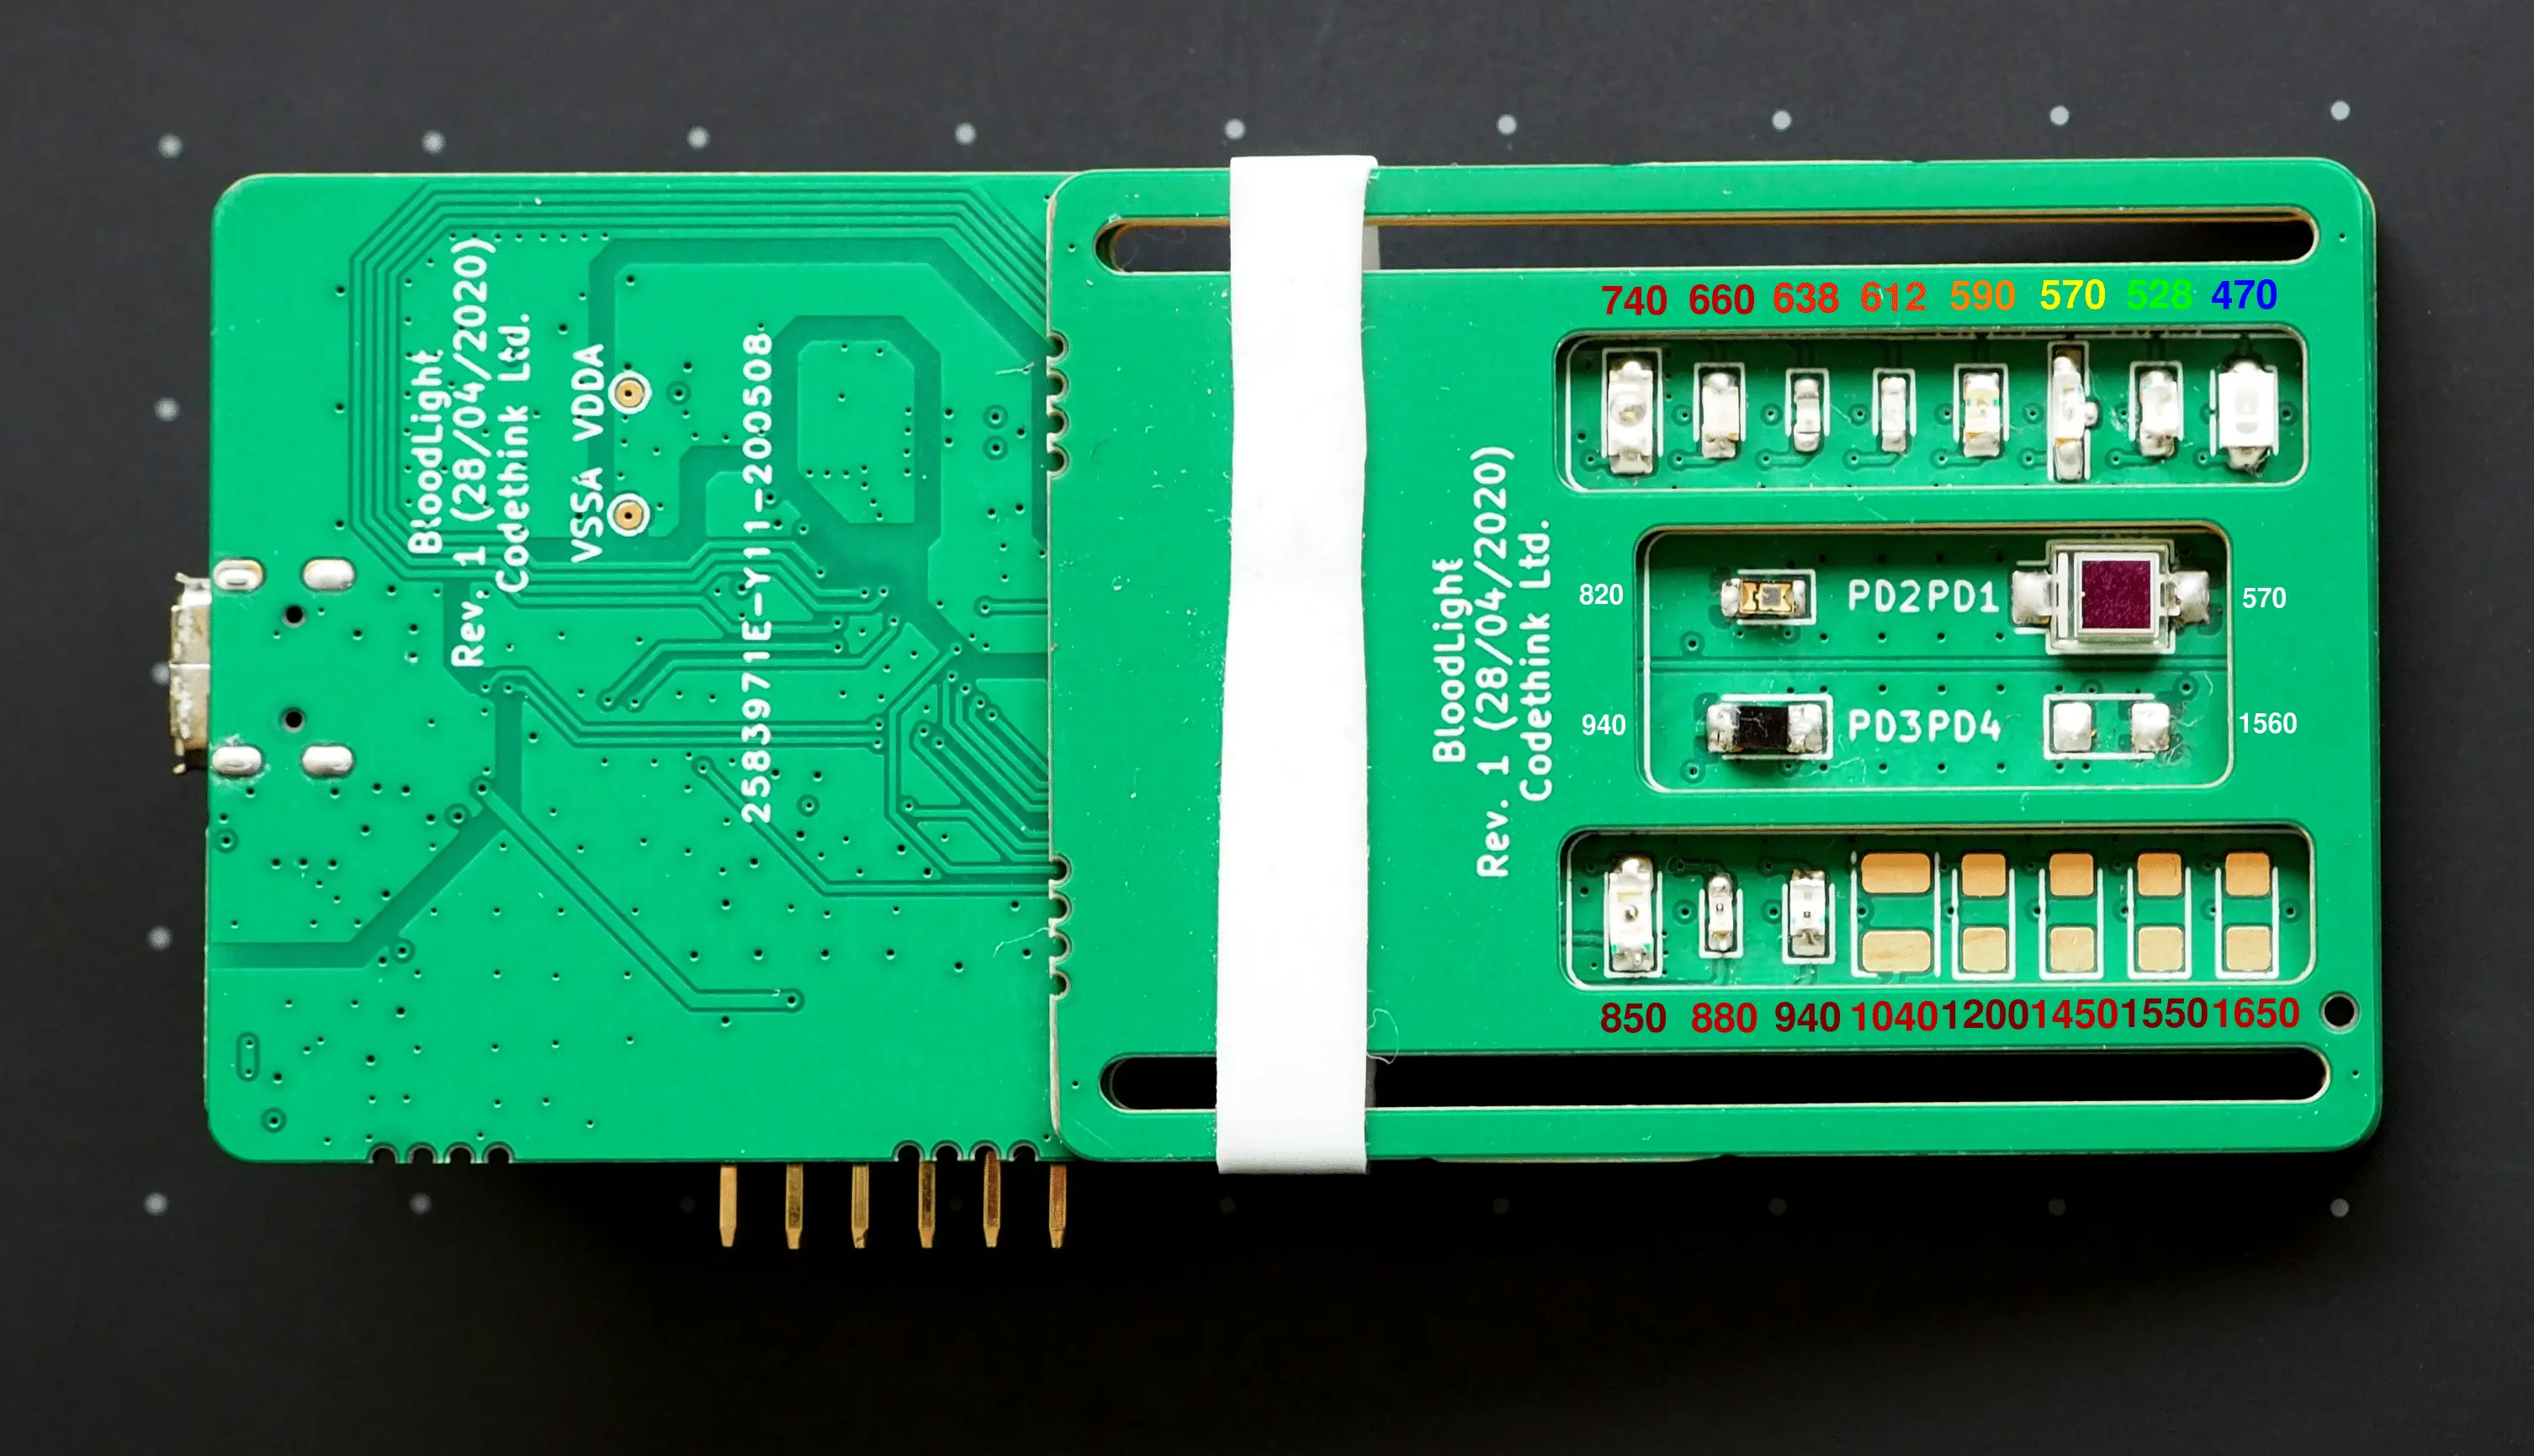
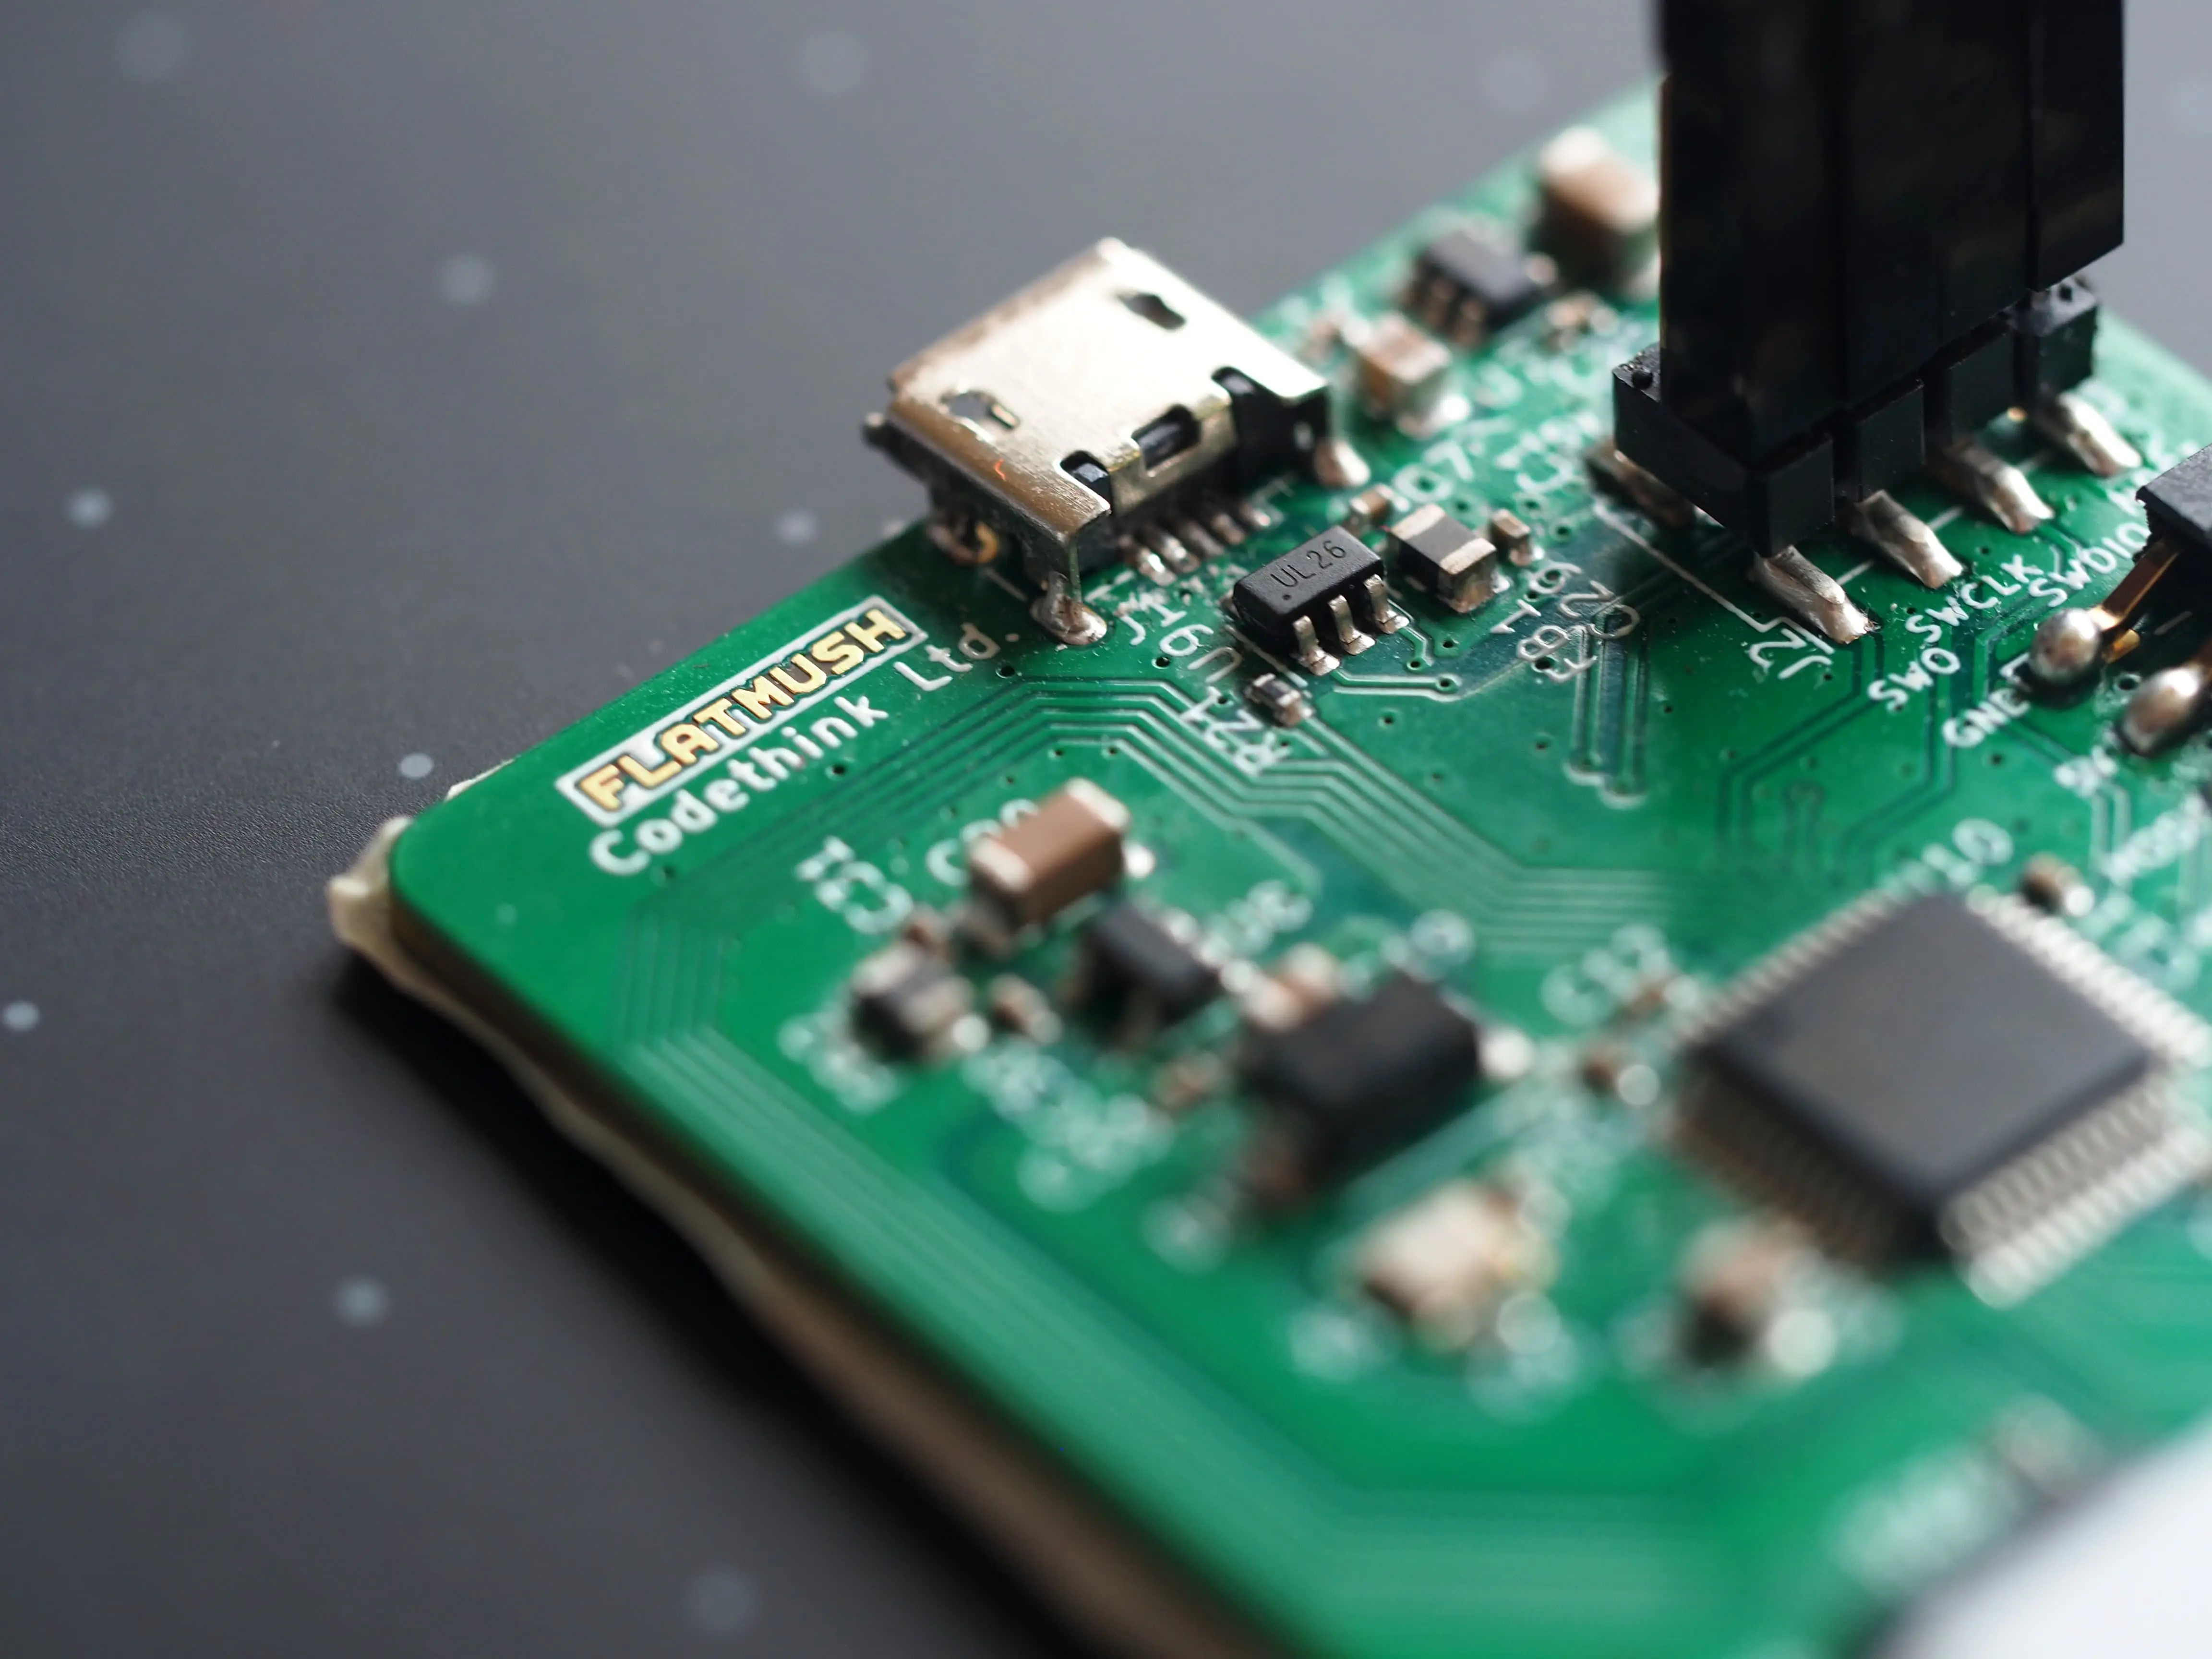
First prototype design
The device has 16 LEDs and 4 photodiodes. Each of the LEDs emits a different wavelength of light. The four photodiodes have different curves for their sensitivities to different wavelengths of light.
This means that one photodiode might be best at picking up a given LED, and the others might detect it a bit or not at all.
As you can see in the image, our initial revision uses a shaped PCB as a shield to protect the photodiodes from direct illumination, to ensure the light has to pass through the skin before being recorded on the photodiode. When the design is more concrete we’ll likely move towards a professionally 3D printed case.
Some wavelengths pass more easily than others through flesh. The red and infra-red wavelengths used by medical pulse oximeters pass through flesh quite well, while the green wavelength used by smart watch sensors get scattered more and don't penetrate so far.
Our initial prototypes use only the lower wavelengths of light as the components are cheaper and more available, but also because we don’t have sensitivities well tweaked for light transmission through a finger or thumb. We hope to improve this in future revisions of the board based on the information we’ve gathered from our initial prototype.
A medical pulse oximeter emits light on one side of the finger and has a detector located on the other side of the finger. Smart watches have the light source and detector on the same side of the wrist, and they detect what light penetrated a short way into the flesh, scattered and reflected back out.
To handle both of these modes of light propagation, the device is designed so it might be used either standalone (reflection mode), or in tandem with a second device, with one controlling the other via Serial Peripheral Interface (SPI).
The hardware was designed with automated assembly in-mind which limited component choice, however, photodiode amplification is used in many industries which means appropriate components are cheap and widely available.
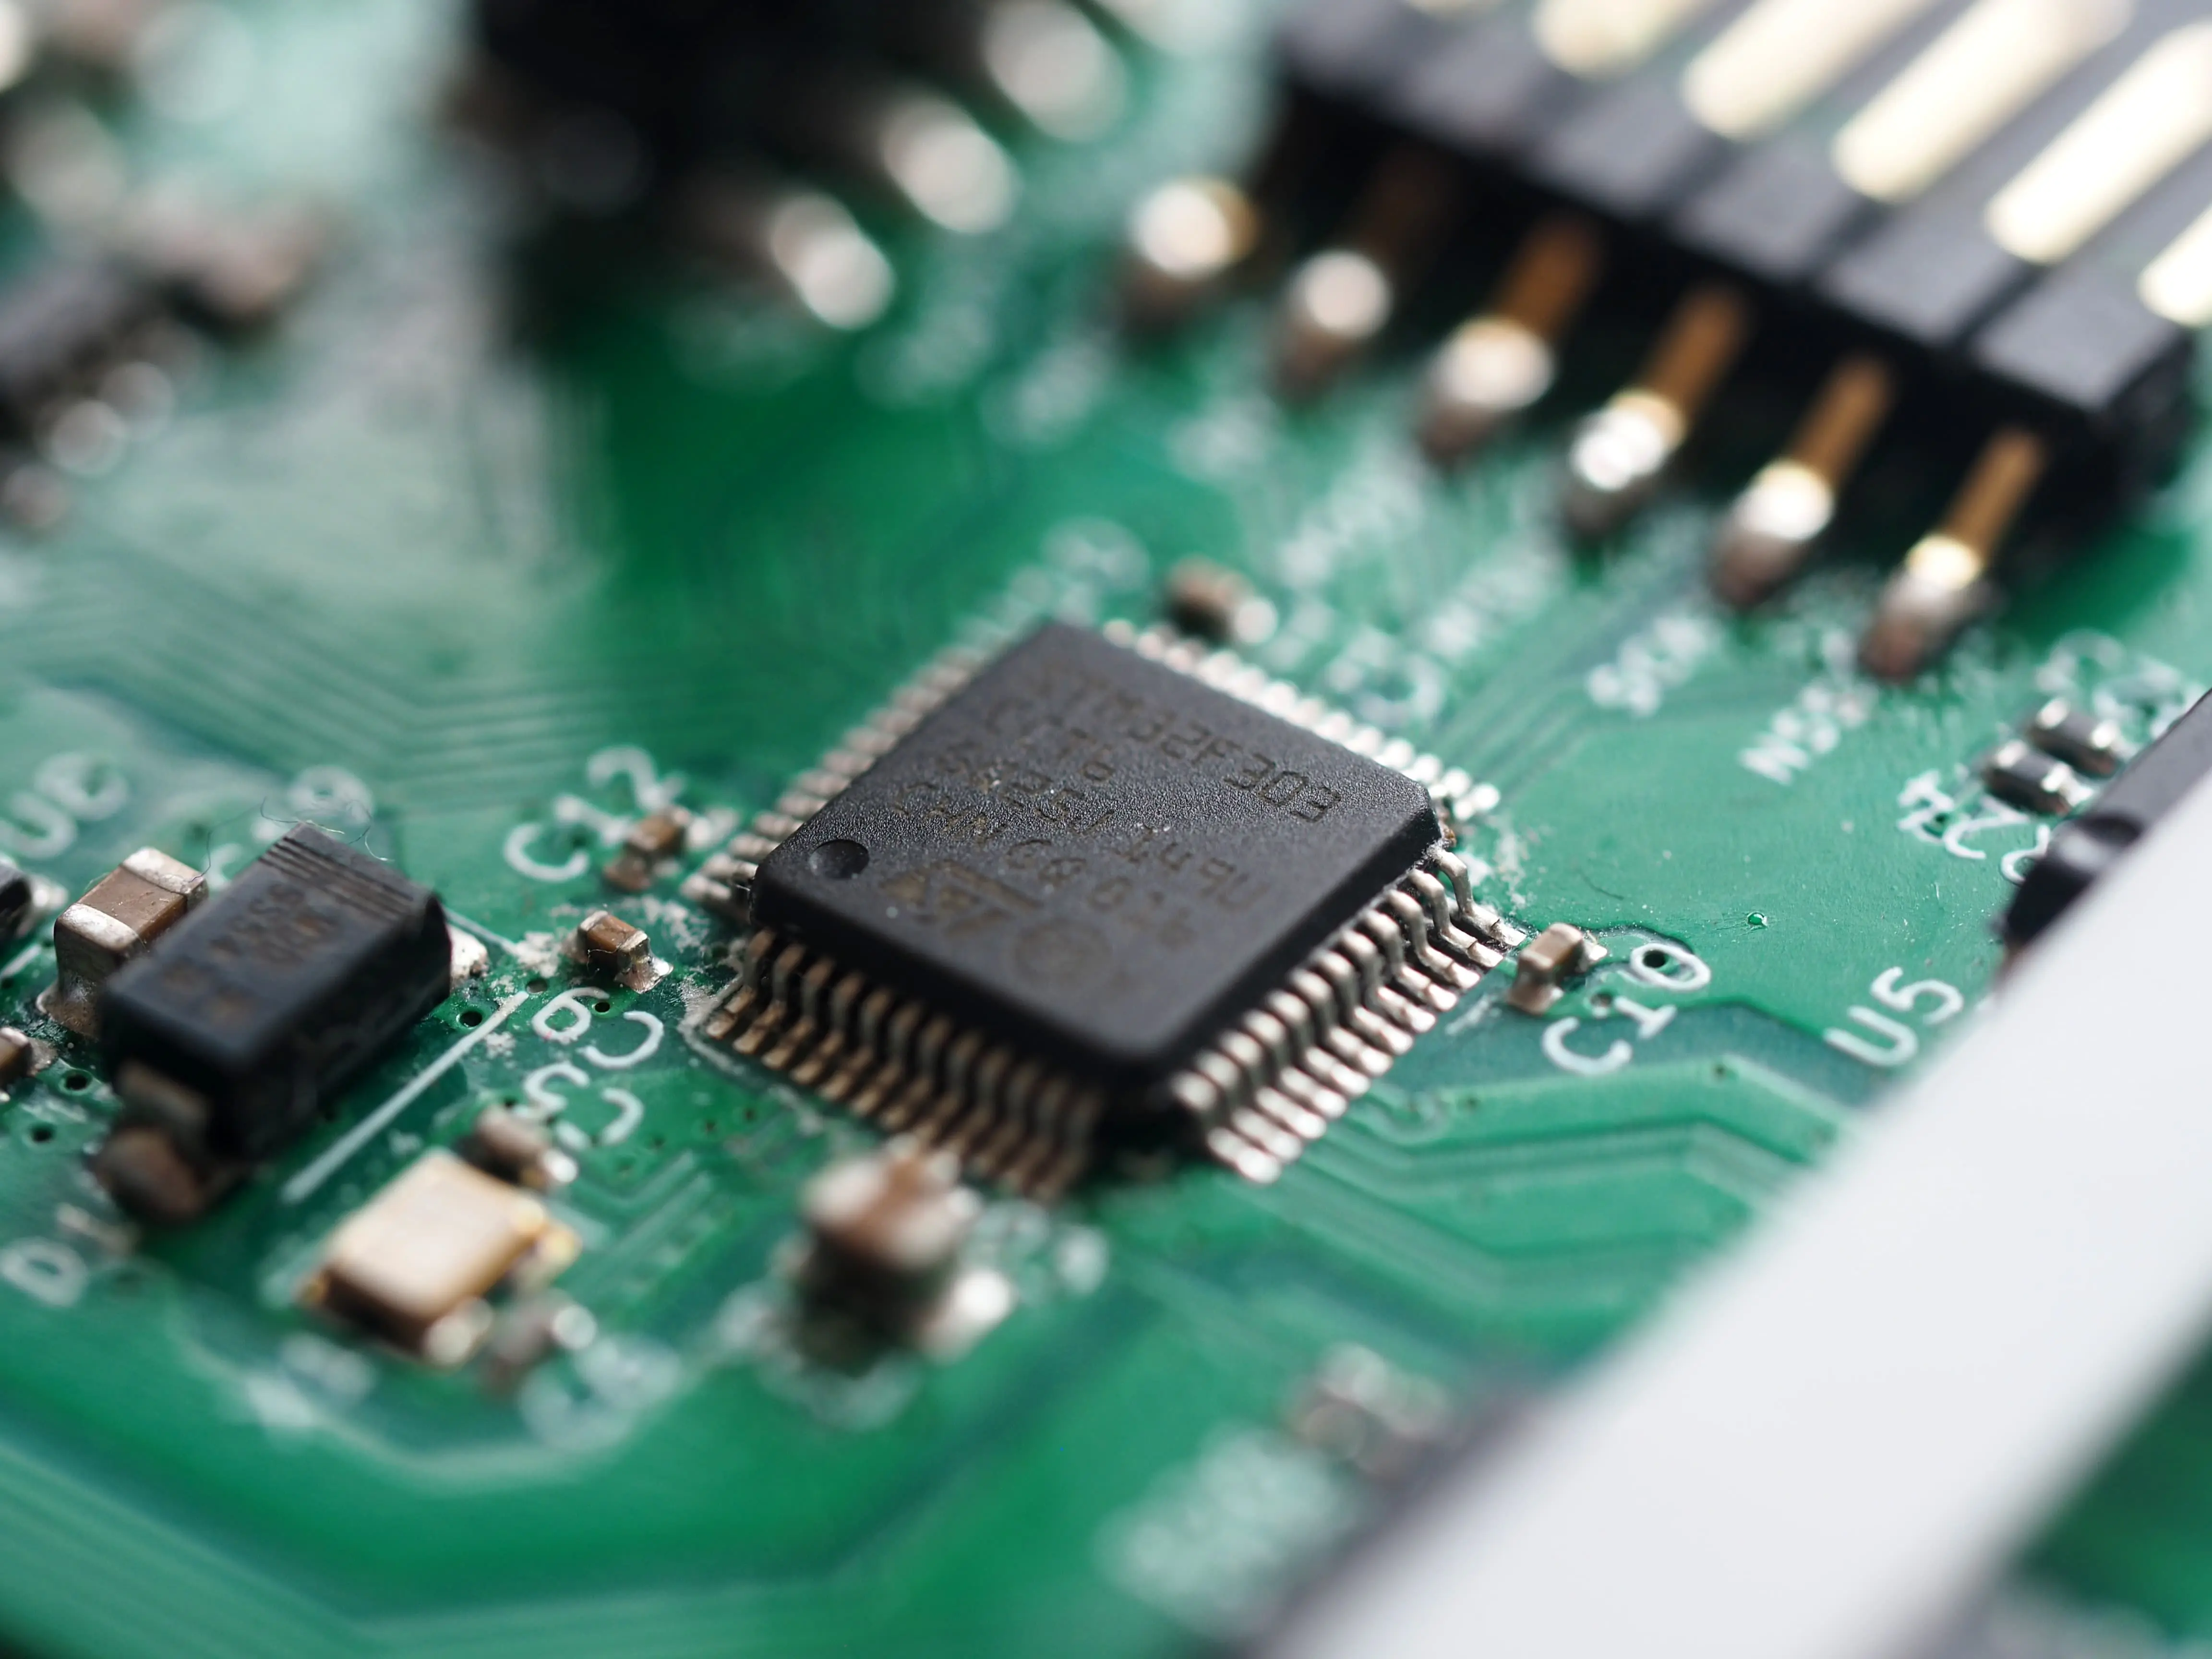
We designed the initial revision of the hardware as a 4-layer board to allow for improved grounding and shielding which is required for low noise operation of the ADCs. Dedicated ground planes were used for analog, digital and clocking of the board.
The board was designed using a recent build of KiCAD 5 which is well suited to this level of complexity/detail.
The initial design had to make a lot of assumptions about the brightness of the LEDs and the sensitivity of the photodiodes used, because of this we designed it to provide heavy and configurable amplification such that we have a wide margin of error. In future designs, we'll tweak the variables based on our measurements so that less configuration is required and so that we get much more accurate readings.

Firmware and tooling
For the firmware, we chose to use libopencm3 to get something up and running quickly. It provides support for STM32 F3 based microcontrollers. It also makes it easy to build a USB Communications Device Class (CDC) device.
In order to meet our requirements we had to make a few patches to libopencm3:
- stm32f3: Enable GPIO ports G and H (Merged.)
- stm32f3: Add support for OPAMP (Open at the time of writing.)
The firmware reads samples from the photodiodes using the analog-to-digital converters (ADCs).
Acquisition is driven by a timer, which triggers the ADC, which triggers Direct memory access (DMA), which causes an interrupt. In the interrupt handlers for each ADC, a per-ADC sample data message is filled up. When the message buffer is filled, the message is marked as ready, and it is sent over USB to the host inside a poll loop.
On the host side there is a simple tool to generate, send, receive, and decode messages. There is another tool which can convert the decoded messages into WAV files, for easy inspection and processing in Audacity.
We’ve got a Pulse!
The hardware was designed to be as sensitive as possible because we had no way of knowing the real sensitivities of the components selected, nor did we know the strength of the light that would be reflected for any given wavelength.
To get our first pulse we amplified the signal by a gain of 16x as this put the signal from our photodiode within the range of the ADC, we then oversampled the signal by 16 times to generate a 16-bit result. Oversampling in this case works because we know that the noise is random by spectral analysis of the voltage lines.
We decided that the easiest way to view a wave was to treat it as audio as we were likely to use the same frequencies and because audio tools such as Audacity contain basic tools for filtering the output. We created a WAV file exporter to export our sample data as a PCM WAV file which we opened in Audacity.
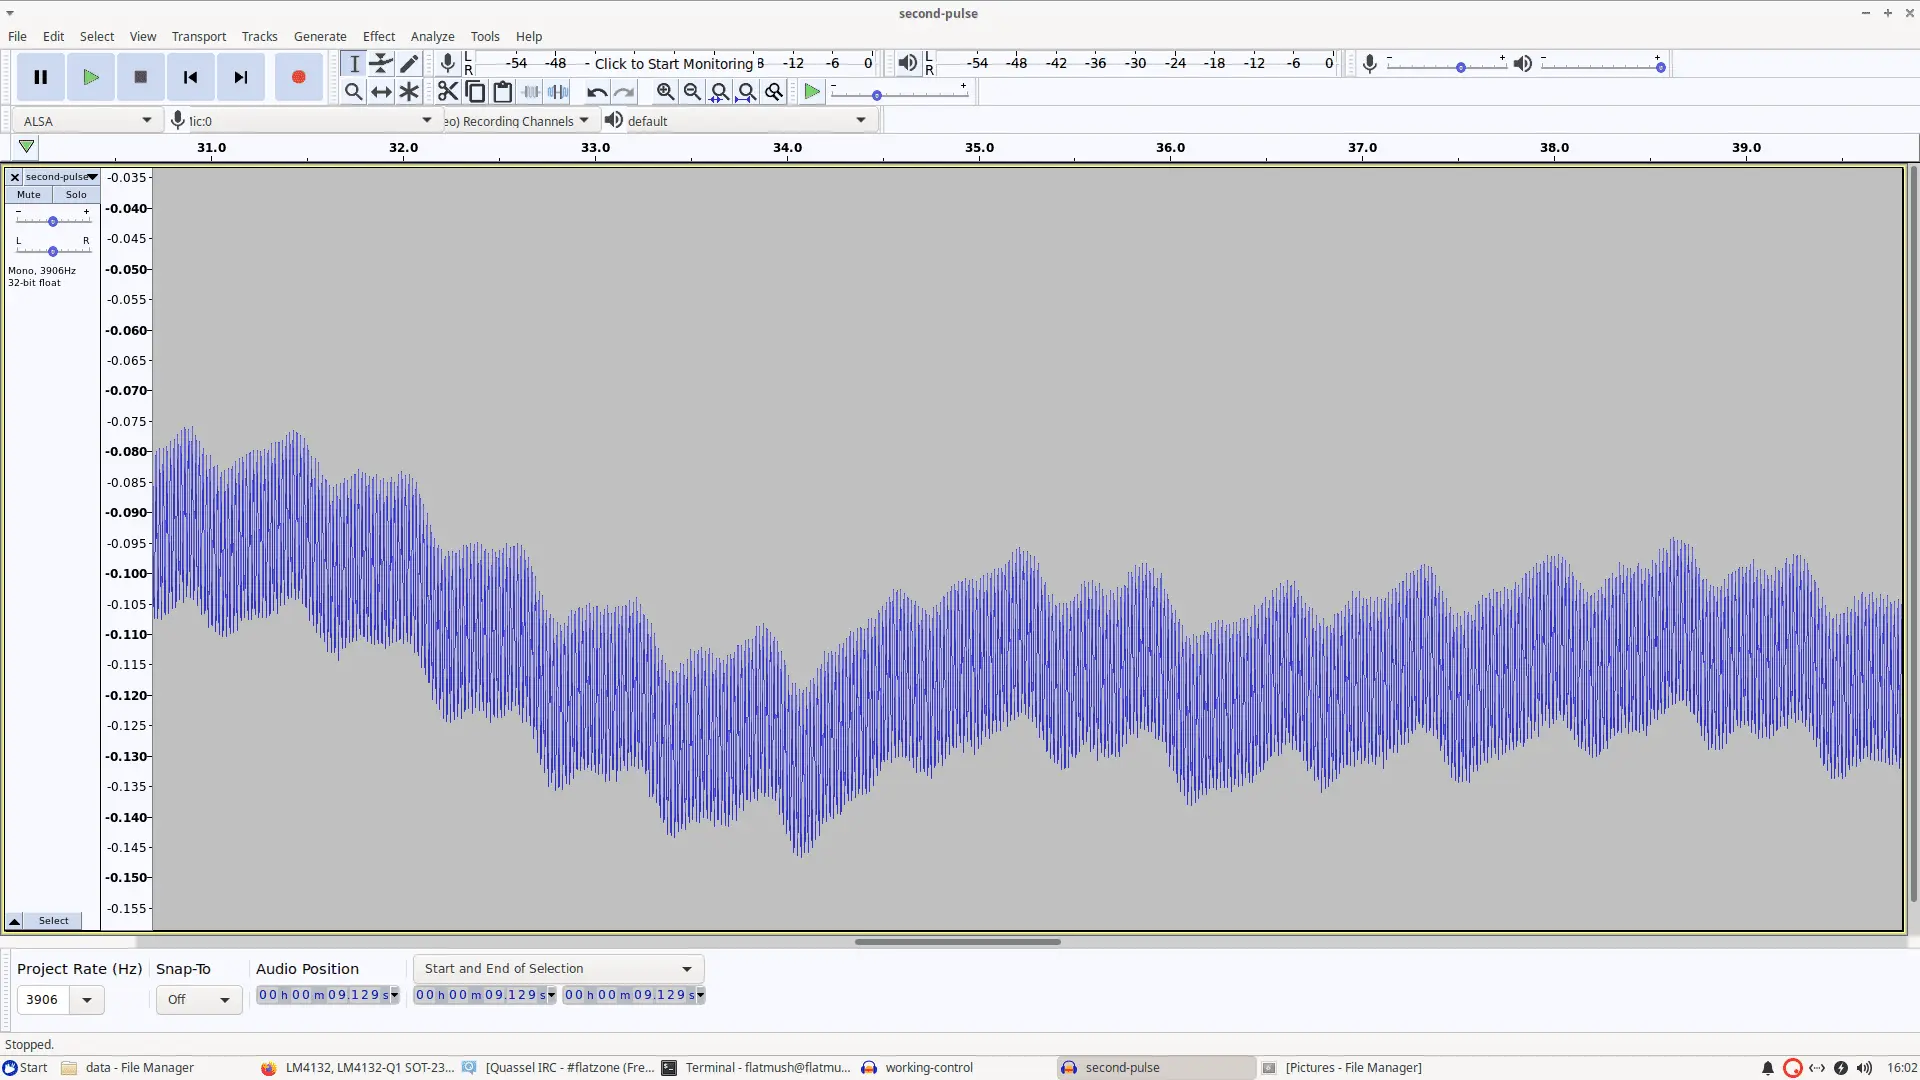
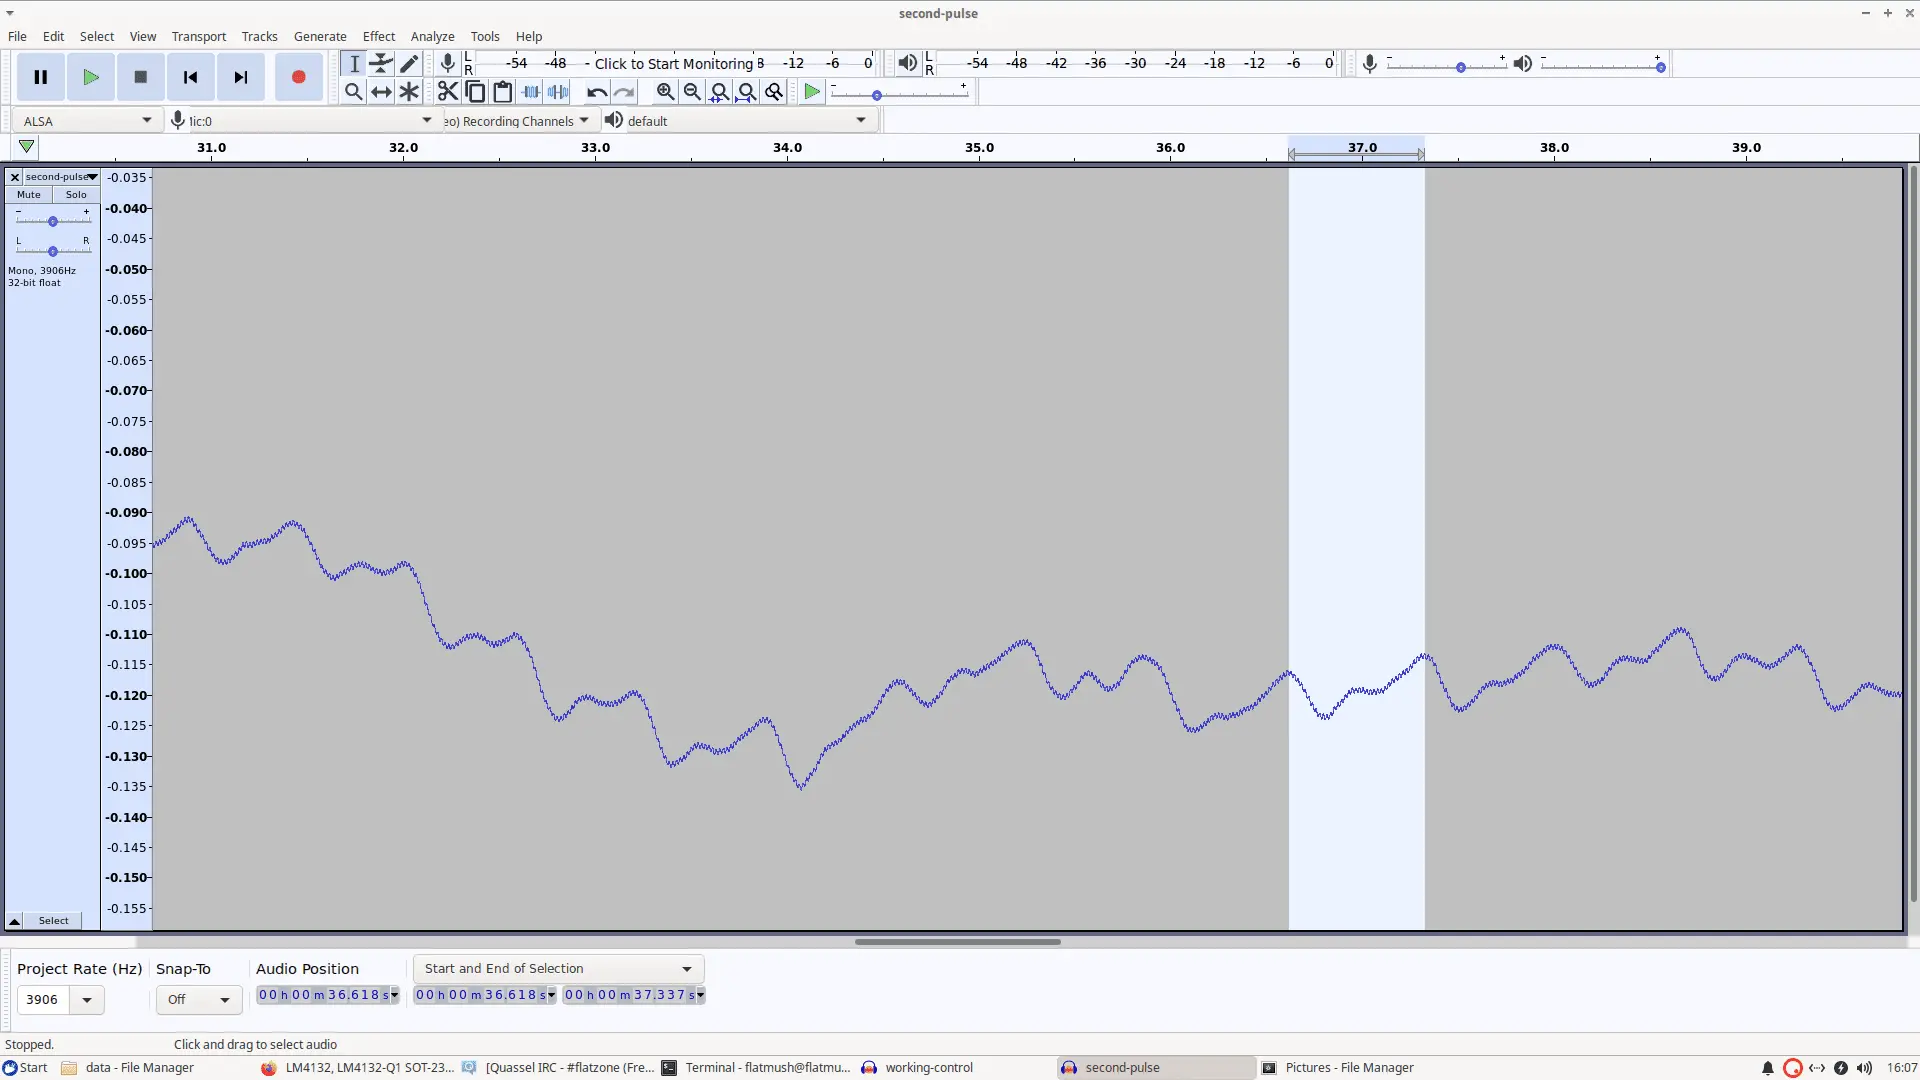
The initial view of the waveform (shown above) looked interesting as there was low and high-frequency noise. Immediately visible was 50Hz AC noise, but spectral analysis showed some other minor frequency spikes. Since we knew that a pulse rate should be expected to be between 0.5-2 Hz we simply filtered out the high-frequency noise (> 10Hz) which gives the relatively clear image of a pulse shown on the right.
Refining the Data
Our initial pulse signal was a success but the amplitude of a pulse reading was 65 out of 65535, so we were covering only 0.1% of the range. Our hardware is limited to 12-bit resolution (oversampled to 16-bit) and any hardware amplification could easily amplify the signal beyond our measurable range, the only option would be to oversample further.
The first step was to measure the signal from a photodiode under relatively constant illumination, we couldn't use electrical light due to 50Hz (in the UK) AC noise, so we placed the device such that it was reading reflected sunlight and took some samples. On analysis the readings showed that the noise we read on the photodiode was random, there were no frequences visible in an FFT, this was good news since it meant that we could oversample abitrarily and gain accuracy.
We created a mechanism in our firmware to sum samples into a 32-bit integer, we provide an offset and shift which is applied to force the samples into a 16-bit word prior to transmission to save bandwidth. With this and a calibration mechanism to discover the best offset/shift values for a given oversample, we started to see some really interesting results.
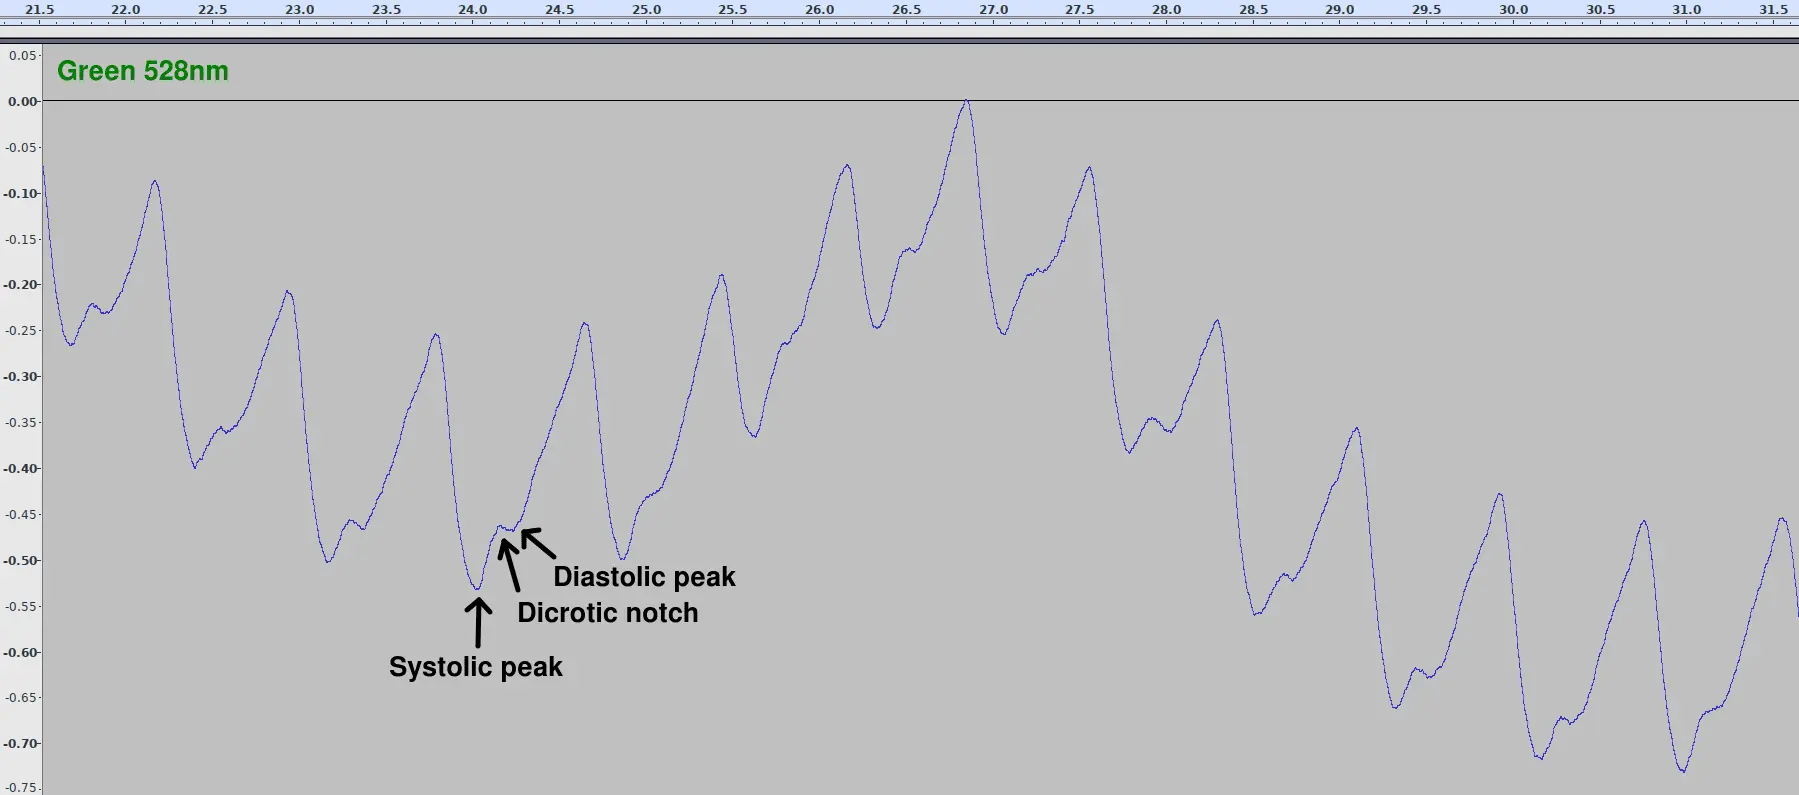
In this image we can see that the pulse is now much clearer than before, with it's height occupying a large amount of the total range. The pulse is so clear here we can start to see the systolic and diastolic peaks, but we still have an issue with low frequency noise that can offset the signal quite heavily. These offsets are due to muscle movements, current smart-watches face the same issue since they use the same wavelength of green light as we used here (528nm).
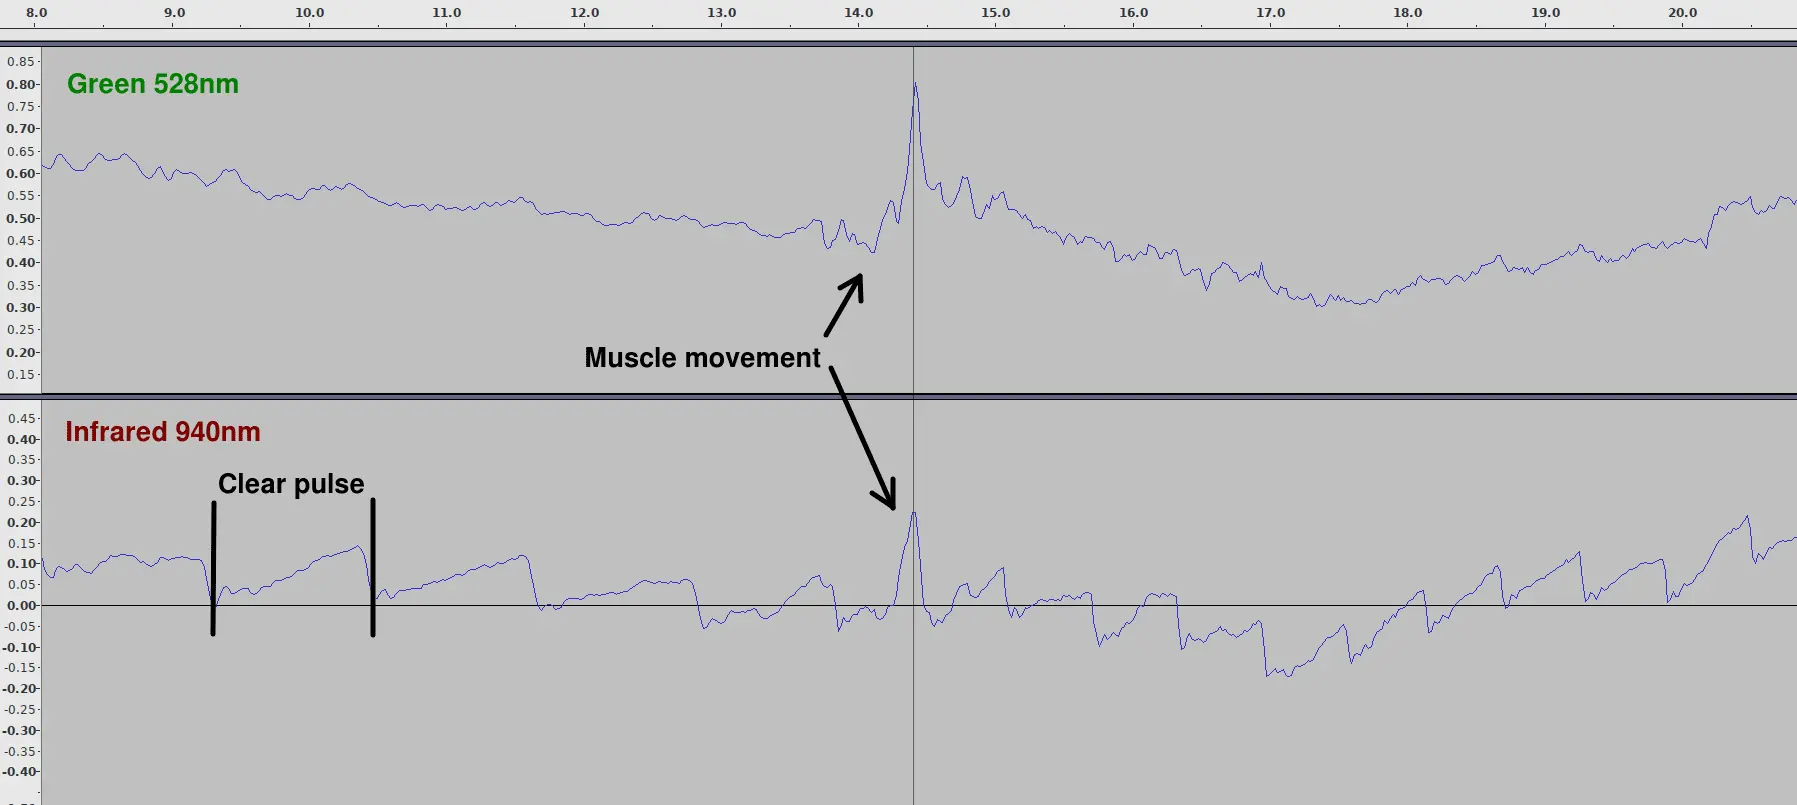
In this image we can see that the pulse level is much more constant, and is effected much less by movement, since infra-red also passes much more easily through dark or tattoo'd skin, it's easy to see why smartwatch vendors believe that red/infra-red light is the future.
Future developments
As with any project, there is always more that can be done. In this section are a few ideas for interesting directions that this project might be taken.
Software improvements
The main things that would be useful are:
- Support for communicating with a second device over SPI to the firmware. This would enable detection of light that passes through flesh, rather than reflected light.
- Support for the device in libsigrok enabling us to view data in real-time with PulseView.
Hardware Improvements
We see a lot of potential with the improvements for hardware. By optimising components, applying voltage offsets and with the software improvements, we expect we will see 250-1000 times the accuracy. This will also be made easier with an upgraded microcontroller. Further improvements are possible by utilizing higher grade components, however the cost also goes up.
There is also scope to reduce the size of the device, that way it can be more widely used, for instance, to fit on a finger.
Data science
The next steps for getting useful readings from the device will focus on getting heart rate data that's clear and reliable. Improvements to the hardware should help with this.
After that, we will be able to examine the data from LEDs of other wavelengths and see if we can correlate the data with what we observe in the green part of the spectrum. There is potential to find wavelengths that can be used to measure heart rates that work on more skin tones or different skin tones. Longer-term, the presence of other important information that can be found in the data, such as hydration, blood sugar levels, and carbon monoxide levels can be investigated.
We're open to collaboration with research institutions and industry; particularly around controlled experimentation targeting specific wavelengths/applications.
Source code
This work is fully open-source hardware and software. If you're interested in collaborating, we are happy to take merge requests.
You can find our work so far below:
-
Hardware repository.
This contains the KiCad files and other related documentation. -
bloodlight-firmware.
This repository contains the firmware and some simple tools to communicate with the device and acquire sample data.
We welcome anyone to join in, experiment with the work and help us to realise its potential.
Other Content
- Assessing the reproducibility workflow in freedesktop-sdk
- Deep Dive into Upstream RISC-V Boot Chain
- Porting an Automotive Operating System to RISC-V
- Understanding Codethink's IEC 61508 Mapping for the Eclipse Trustable Software Framework
- Resisting Hyrum's Law with Private Constructors in Python
- FOSDEM 2026
- Building on STPA: How TSF and RAFIA can uncover misbehaviours in complex software integration
- Adding big‑endian support to CVA6 RISC‑V FPGA processor
- Bringing up a new distro for the CVA6 RISC‑V FPGA processor
- Externally verifying Linux deadline scheduling with reproducible embedded Rust
- Engineering Trust: Formulating Continuous Compliance for Open Source
- Why Renting Software Is a Dangerous Game
- Linux vs. QNX in Safety-Critical Systems: A Pragmatic View
- Is Rust ready for safety related applications?
- The open projects rethinking safety culture
- RISC-V Summit Europe 2025: What to Expect from Codethink
- Cyber Resilience Act (CRA): What You Need to Know
- Podcast: Embedded Insiders with John Ellis
- To boldly big-endian where no one has big-endianded before
- How Continuous Testing Helps OEMs Navigate UNECE R155/156
- Codethink’s Insights and Highlights from FOSDEM 2025
- CES 2025 Roundup: Codethink's Highlights from Las Vegas
- FOSDEM 2025: What to Expect from Codethink
- Codethink/Arm White Paper: Arm STLs at Runtime on Linux
- Speed Up Embedded Software Testing with QEMU
- Open Source Summit Europe (OSSEU) 2024
- Watch: Real-time Scheduling Fault Simulation
- Improving systemd’s integration testing infrastructure (part 2)
- Meet the Team: Laurence Urhegyi
- A new way to develop on Linux - Part II
- Shaping the future of GNOME: GUADEC 2024
- Developing a cryptographically secure bootloader for RISC-V in Rust
- Meet the Team: Philip Martin
- Improving systemd’s integration testing infrastructure (part 1)
- A new way to develop on Linux
- RISC-V Summit Europe 2024
- Safety Frontier: A Retrospective on ELISA
- Codethink sponsors Outreachy
- The Linux kernel is a CNA - so what?
- GNOME OS + systemd-sysupdate
- Codethink has achieved ISO 9001:2015 accreditation
- Outreachy internship: Improving end-to-end testing for GNOME
- Lessons learnt from building a distributed system in Rust
- FOSDEM 2024
- QAnvas and QAD: Streamlining UI Testing for Embedded Systems
- Outreachy: Supporting the open source community through mentorship programmes
- Using Git LFS and fast-import together
- Testing in a Box: Streamlining Embedded Systems Testing
- SDV Europe: What Codethink has planned
- How do Hardware Security Modules impact the automotive sector? The final blog in a three part discussion
- How do Hardware Security Modules impact the automotive sector? Part two of a three part discussion
- How do Hardware Security Modules impact the automotive sector? Part one of a three part discussion
- Automated Kernel Testing on RISC-V Hardware
- Automated end-to-end testing for Android Automotive on Hardware
- GUADEC 2023
- Embedded Open Source Summit 2023
- Full archive