Codethink is a software company that works on various client projects; ranging from medical, finance, automotive. In these different areas of engagement; we are trusted to work on various types of problems that clients face with their systems. One such problem encountered required us looking at a userspace software where the program was occasionally not responding on time. This proved to be a challenging problem, due to the fact that the problem is not seen on every cycle or every try. This is how we used Tracecompass to solve that problem.
After initial debugging, we were fairly convinced that this problem was caused by process scheduling, and that the process was not being allocated CPU on time. The scheduler is a component of the kernel that decides which runnable thread will be executed by the CPU next. Since this problem is now a suspected problem from the scheduler we decided to look into how the different threads are getting scheduled. There are many tools to look into Linux kernel internals, the most basic of them is ftrace. This can be used to trace functions or kernel events through hundreds of static event points that are placed inside the kernel code at various places. There are also tools which have used ftrace and extended its functionality even more and one such tool is LTTng. LTTng has been designed to provide a low overhead tracing on production systems. The tracers achieve this great performance through a combination of essential techniques such as per-CPU buffering, RCU data structures, a compact and efficient binary trace format, and more. LTTng disturbs the traced system as little as possible in order to make tracing of subtle race conditions and rare interrupt cascades possible.
Installing LTTng was a fairly straight forward,two step process:
- Add LTTng module to the kernel.
- Build and install the userspace component.
Once LTTng was working on our client hardware, we started looking for different tools that can analyse the trace and present it in a user-friendly form. Lots of viewers are available like:
Babeltrace can be used to convert the generated trace to text format or write custom analysis with python. Looking at all the available options and evaluating them against our task, we decided to go for tracecompass, which is an Open Source application to solve performance and reliability issues by reading and analysing traces and logs of a system. Its goal is to provide views, graphs, metrics, and more to help the user to extract useful information from traces. This is done in a way that is more user-friendly and informative than producing huge text dumps.
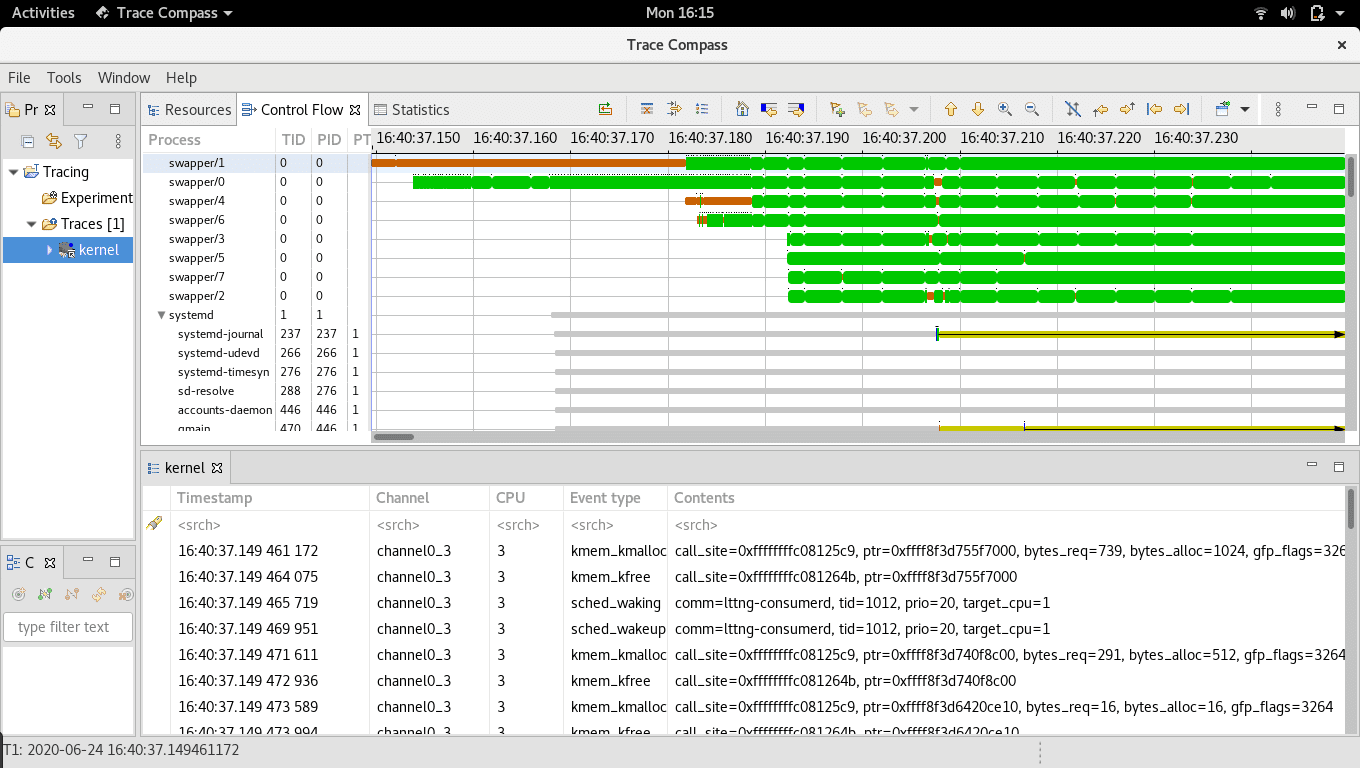
After a decision on the project tools was made, we started setting up the client system for an auto-test where a script will start an LTTng session, trigger the steps needed to reproduce the problem and save the logs. This is left to run overnight, before checking the logs next morning. Then we run another script on it to find the particular cycle where the problem was reproduced (if it was). After a few days of testing we have collected some cycles of logs with the problem, and we started looking at the LTTng trace using tracecompass. Our log collection script had been collecting top logs also and we got the pid and tid from that log which we will need to trace in tracecompass. Tracecompass will then display the data in the form of graphs which are easy to visualize. An example trace is:
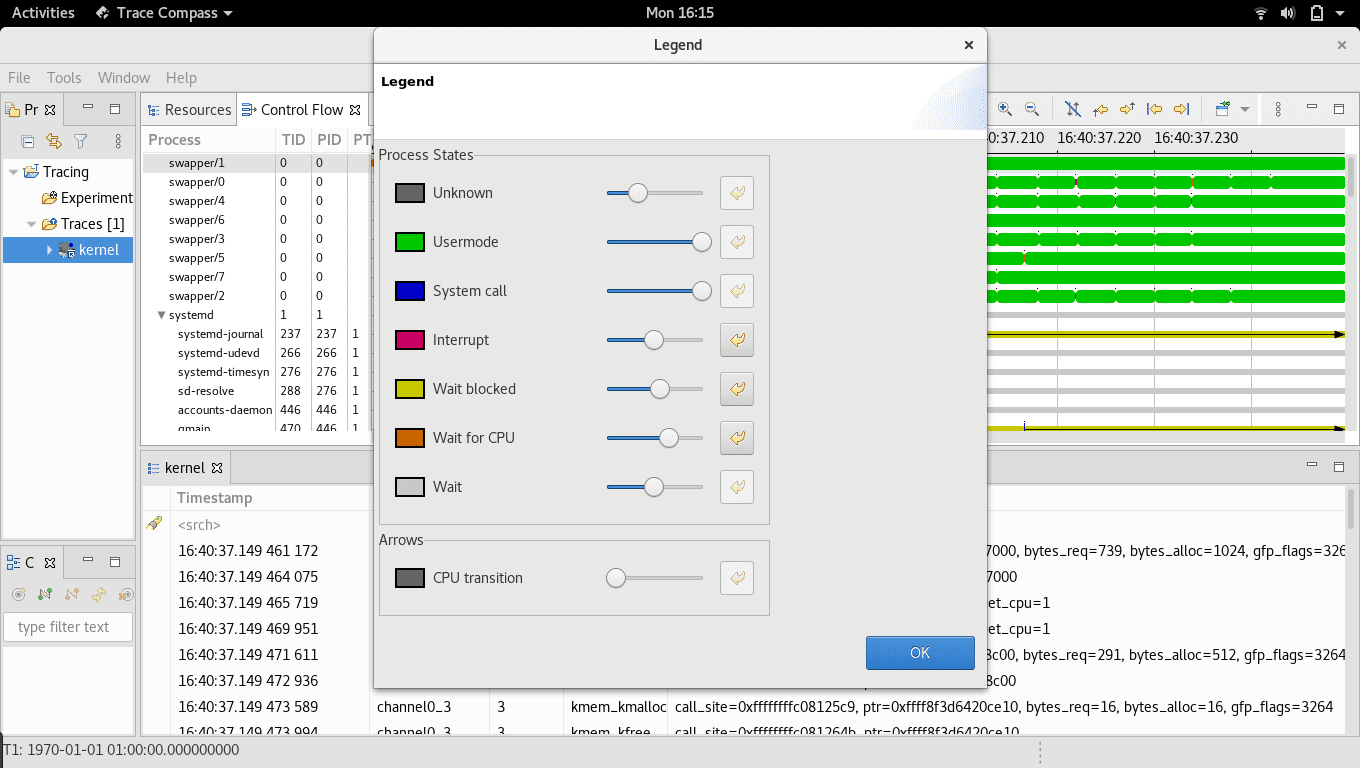
The colour codes used by the graphs are also defined.
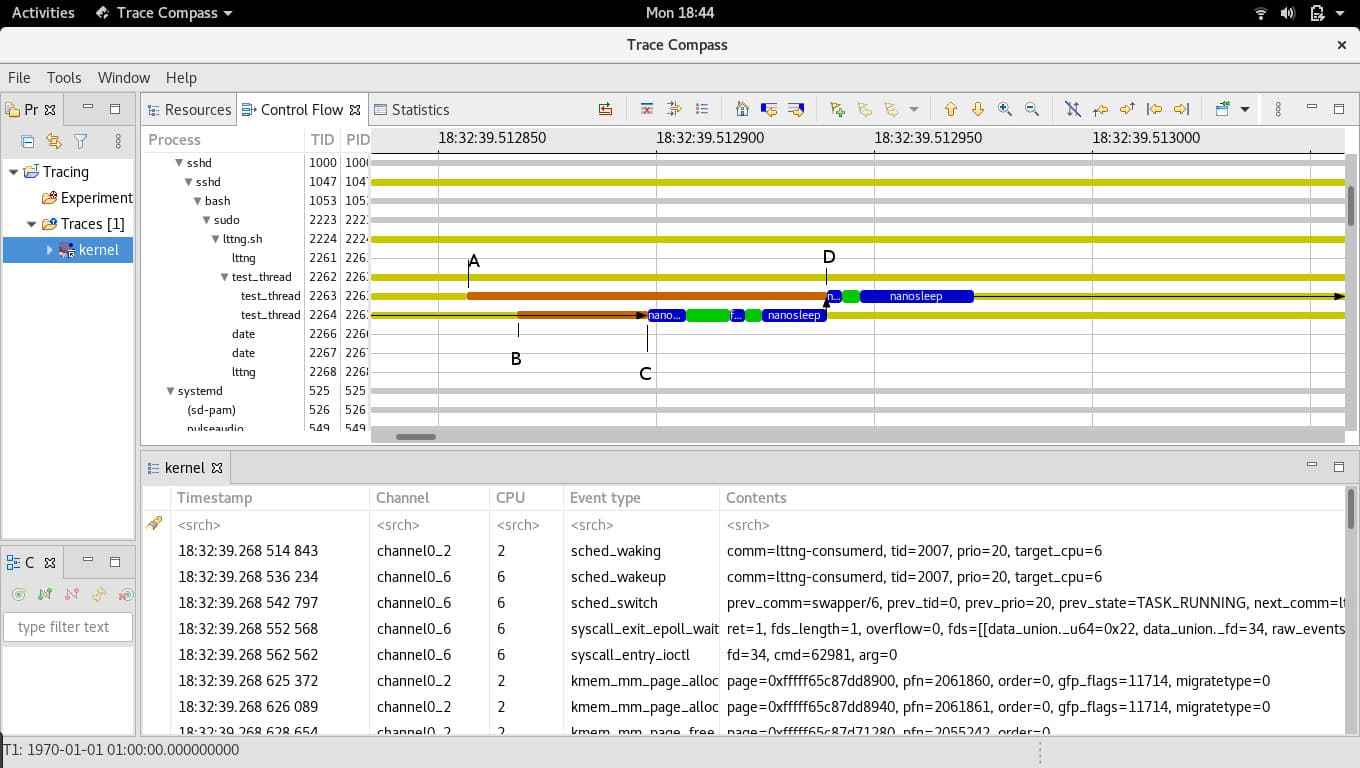
After going through the logs we found the problem and it was indeed because of a thread getting blocked due to the CPU being unavailable. We can not show the client log here, but we recreated the original problem by tweaking the process priorities which can show a similar trace in tracecompass.
The test_thread process with tid: 2263 and tid: 2264 are our test threads. At point A, thread tid:2263 started waiting for CPU, at point B thread tid: 2264 started wait and they both were in “Wait for CPU” mode till point C. At that point the scheduler decided to allot the CPU to tid:2264 even though 2263 had been waiting for more time (from A). The thread tid:2263 got CPU at point D when tid:2264 finished. It was easy to suggest a fix once we knew what the problem was, and the suggested solution was again tested in our auto-test setup to confirm that it actually works before delivering to the client.
Other Content
- FOSDEM 2026
- Building on STPA: How TSF and RAFIA can uncover misbehaviours in complex software integration
- Adding big‑endian support to CVA6 RISC‑V FPGA processor
- Bringing up a new distro for the CVA6 RISC‑V FPGA processor
- Externally verifying Linux deadline scheduling with reproducible embedded Rust
- Engineering Trust: Formulating Continuous Compliance for Open Source
- Why Renting Software Is a Dangerous Game
- Linux vs. QNX in Safety-Critical Systems: A Pragmatic View
- Is Rust ready for safety related applications?
- The open projects rethinking safety culture
- RISC-V Summit Europe 2025: What to Expect from Codethink
- Cyber Resilience Act (CRA): What You Need to Know
- Podcast: Embedded Insiders with John Ellis
- To boldly big-endian where no one has big-endianded before
- How Continuous Testing Helps OEMs Navigate UNECE R155/156
- Codethink’s Insights and Highlights from FOSDEM 2025
- CES 2025 Roundup: Codethink's Highlights from Las Vegas
- FOSDEM 2025: What to Expect from Codethink
- Codethink/Arm White Paper: Arm STLs at Runtime on Linux
- Speed Up Embedded Software Testing with QEMU
- Open Source Summit Europe (OSSEU) 2024
- Watch: Real-time Scheduling Fault Simulation
- Improving systemd’s integration testing infrastructure (part 2)
- Meet the Team: Laurence Urhegyi
- A new way to develop on Linux - Part II
- Shaping the future of GNOME: GUADEC 2024
- Developing a cryptographically secure bootloader for RISC-V in Rust
- Meet the Team: Philip Martin
- Improving systemd’s integration testing infrastructure (part 1)
- A new way to develop on Linux
- RISC-V Summit Europe 2024
- Safety Frontier: A Retrospective on ELISA
- Codethink sponsors Outreachy
- The Linux kernel is a CNA - so what?
- GNOME OS + systemd-sysupdate
- Codethink has achieved ISO 9001:2015 accreditation
- Outreachy internship: Improving end-to-end testing for GNOME
- Lessons learnt from building a distributed system in Rust
- FOSDEM 2024
- QAnvas and QAD: Streamlining UI Testing for Embedded Systems
- Outreachy: Supporting the open source community through mentorship programmes
- Using Git LFS and fast-import together
- Testing in a Box: Streamlining Embedded Systems Testing
- SDV Europe: What Codethink has planned
- How do Hardware Security Modules impact the automotive sector? The final blog in a three part discussion
- How do Hardware Security Modules impact the automotive sector? Part two of a three part discussion
- How do Hardware Security Modules impact the automotive sector? Part one of a three part discussion
- Automated Kernel Testing on RISC-V Hardware
- Automated end-to-end testing for Android Automotive on Hardware
- GUADEC 2023
- Embedded Open Source Summit 2023
- RISC-V: Exploring a Bug in Stack Unwinding
- Adding RISC-V Vector Cryptography Extension support to QEMU
- Introducing Our New Open-Source Tool: Quality Assurance Daemon
- Full archive


