This post was originally a quick email to a client and their other partners detailing what the output from the "top" tool means, which is a utility which shows a list of running processes on a UNIX system along with statistics on their memory and CPU consumption.
Here's an example of what top displays:
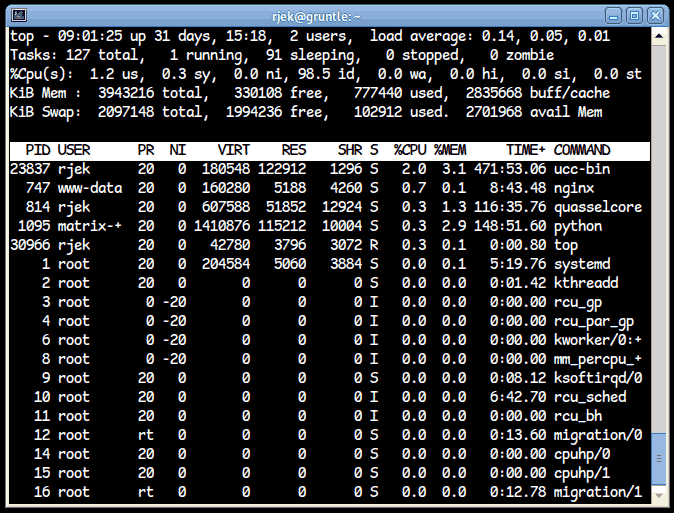
I'll dismantle the lines one by one, from the 'top'. I'm sure a lot of this is already known by you all or be obvious, but it may be worth exploring it all just in case, as there's a lot of confusion about some of the data here.
Line 1: time, uptime, logged in users, load averages
- Current local time
- Time system the system booted
- Logged in users: Number of interactive sessions (console, ssh, etc)
- Load averages: There are three load average numbers, and these are the average "load" of the system over 1 minute, 5 minutes, and 15 minutes. Load is calculated by adding 1 for any process or thread that is one of:
- Runnable if CPU resources available (R-state)
- Waiting on IO (D-state)
In the above image, the instantaneous load is exactly 1 (there is one process, top itself, running), but this number is not useful to know. This is why the numbers are averaged over time.
Line 2: Task statistics
- Total number of tasks (or processes).
- Running tasks (or more accurately, runnable; as you can only run as many tasks simultaneously as you have hardware threads).
- Sleeping tasks which are not currently requesting any CPU or IO resources at all (perhaps waiting on a socket, for example.)
- Stopped tasks, which have been sent SIGSLEEP to temporary remove them from the scheduler's task list.
- Zombie tasks. These have died (naturally or otherwise), but their parent process is yet to call wait() on them to collect their exit status.
Line 3: CPU usage distribution
Total userland usage, kernel/system usage, "nice" process usage, idle time, IO wait, hardware interrupt time, software interrupt time, stolen time.
The important thing to remember is that this is all "wallclock time", time as a clock on the wall might measure it, not CPU time, and they don't always add up. They are all expressed as percentages of available CPU time used since top last refreshed.
- Total userland usage ('us'): The amount of available CPU time used by userland processes.
- Kernel/system usage ('sy'): The amount of available CPU time used by Linux itself.
- "Nice" process usage: The amount of available CPU time used by low-priority processes (manipulated by the 'nice' command).
- Idle time ('id'): The amount of available CPU time spent with nothing to do.
- IO wait time ('wa'): The amount of available CPU time spent waiting for IO to complete.
- Hardware interrupt time ('hi'): The amount of available CPU time used servicing hardware interrupts.
- Software interrupt time ('si'): The amount of available CPU time used servicing software interrupts. (System calls)
- Stolen time ('st'): Estimate of time stolen by the Hypervisor's overhead when running the system in a VM. This should always be zero on bare-metal systems, and not all hypervisors report it to their guests, meaning Linux cannot know the available CPU time is varying.
Line 4: Hardware memory summary
Total hardware memory, total used by processes and kernel, unused memory, kernel buffers.
- Total hardware memory is what is wired to the CPU and not reserved for other parts of the system. In this case, 4GB minus the memory used by PCI and the GPU.
- Entirely inused memory is free.
- Total used by processes is what is consumed in userland, ie applications.
- Buffers and cache are essentially memory used by Linux itself for managing IO and housekeeping. This is physical memory that has been used to cache the contents of block devices (eMMC, SSD, USB sticks, etc). It is not "used" in a traditional sense; the instant a userland process requires more RAM and there is no unused RAM, this RAM is instantly raided to satisfy the request.
Line 5: Swap memory summary
Total swap, free swap, used swap, total available memory. Swap memory is block-device (such as a hard drive, or a compressed RAM disc) memory used to page out data from real memory that Linux believes not to be in use, freeing real memory for use by applications and Linux for caching.
Process table
Now comes a table of processes and statistics. The columns are as follows:
- PID: Process identifier. Typically a 16 bit number, 0 is forbidden, 1 is 'init': It is responsible for booting the system, starting and monitoring services, and is the parent of last resort that adopts processes whose parent has died.
- USER: The username or number the process is running as.
- PR: The process's priority. This normally runs from -20 to 20, where the lower the number, the higher the priority. There is also an 'RT' real-time priority which trumps all. It is not "real time", in the embedded sense.
- NI: Niceness. This is an offset to apply to the normal priority. It is normally zero.
- VIRT: Virtual memory size. This is the size of the process's address space. This doesn't mean it is all memory used, however: some may be maps of files on disc, or may be yet unused and not had real RAM allocated to back it.
- RES: Resident size. This is how much RAM the process actually has allocated to it. This may be backed by physical RAM or by swap.
- SHR: Sharable memory. This is the amount of memory being used that could possibly be or might even be shared with other processes. This includes shared memory used for IPC, as well as memory maps of files on disc (such as the executable itself, shared libraries, etc.)
- S: State. S = sleeping, R = runnable, D = blocked waiting for IO, Z = waiting for parent process to collect exit status.
- CPU: Percentage of CPU used by this process since the last refresh. Note that 100% is 100% of one thread. In a quad-core system, this could reach the high 300s.
- MEM: Percentage of available RAM (combined physical and swap) that this process is using, as a factor of its RES, described above.
- TIME: CPU seconds used by this process since it started. What this means is that if it were to use a whole CPU thread for a second (or 50% of a thread for two seconds), 1 will be added.
- COMMAND: Title of process.
Note: This document is licensed under CC-BY-SA and was originally created by Codethink Ltd.
Other Content
- FOSDEM 2026
- Building on STPA: How TSF and RAFIA can uncover misbehaviours in complex software integration
- Adding big‑endian support to CVA6 RISC‑V FPGA processor
- Bringing up a new distro for the CVA6 RISC‑V FPGA processor
- Externally verifying Linux deadline scheduling with reproducible embedded Rust
- Engineering Trust: Formulating Continuous Compliance for Open Source
- Why Renting Software Is a Dangerous Game
- Linux vs. QNX in Safety-Critical Systems: A Pragmatic View
- Is Rust ready for safety related applications?
- The open projects rethinking safety culture
- RISC-V Summit Europe 2025: What to Expect from Codethink
- Cyber Resilience Act (CRA): What You Need to Know
- Podcast: Embedded Insiders with John Ellis
- To boldly big-endian where no one has big-endianded before
- How Continuous Testing Helps OEMs Navigate UNECE R155/156
- Codethink’s Insights and Highlights from FOSDEM 2025
- CES 2025 Roundup: Codethink's Highlights from Las Vegas
- FOSDEM 2025: What to Expect from Codethink
- Codethink/Arm White Paper: Arm STLs at Runtime on Linux
- Speed Up Embedded Software Testing with QEMU
- Open Source Summit Europe (OSSEU) 2024
- Watch: Real-time Scheduling Fault Simulation
- Improving systemd’s integration testing infrastructure (part 2)
- Meet the Team: Laurence Urhegyi
- A new way to develop on Linux - Part II
- Shaping the future of GNOME: GUADEC 2024
- Developing a cryptographically secure bootloader for RISC-V in Rust
- Meet the Team: Philip Martin
- Improving systemd’s integration testing infrastructure (part 1)
- A new way to develop on Linux
- RISC-V Summit Europe 2024
- Safety Frontier: A Retrospective on ELISA
- Codethink sponsors Outreachy
- The Linux kernel is a CNA - so what?
- GNOME OS + systemd-sysupdate
- Codethink has achieved ISO 9001:2015 accreditation
- Outreachy internship: Improving end-to-end testing for GNOME
- Lessons learnt from building a distributed system in Rust
- FOSDEM 2024
- QAnvas and QAD: Streamlining UI Testing for Embedded Systems
- Outreachy: Supporting the open source community through mentorship programmes
- Using Git LFS and fast-import together
- Testing in a Box: Streamlining Embedded Systems Testing
- SDV Europe: What Codethink has planned
- How do Hardware Security Modules impact the automotive sector? The final blog in a three part discussion
- How do Hardware Security Modules impact the automotive sector? Part two of a three part discussion
- How do Hardware Security Modules impact the automotive sector? Part one of a three part discussion
- Automated Kernel Testing on RISC-V Hardware
- Automated end-to-end testing for Android Automotive on Hardware
- GUADEC 2023
- Embedded Open Source Summit 2023
- RISC-V: Exploring a Bug in Stack Unwinding
- Adding RISC-V Vector Cryptography Extension support to QEMU
- Full archive