In this post I'm going to talk about the recent tranche of work I've put into a tool I wrote called topplot, which plots graphs from the data produced by the system utility top.
It's not a large or complex tool, but does have some fiddly sections of code, so the usual maintenance issue arises of coming back to code you wrote months ago and having to relearn your own work. Having evolved from an urgent need in the field rather than being formally designed, I've started to rectify some the issues this has caused, and to put in place tooling to help maintain good practice in the future.
Background
I wrote the first iteration of topplot when, on a previous project at Codethink, the customer furnished us with an issue report which had 300,000 lines of top logs, and I baulked at the job of finding needles in a haystack that huge. I looked for an existing tool to produce graphs from the data, didn't find one, so wrote my own. And now, should anyone else be in a similar situation, hopefully they'll come across topplot :)
top displays as text the resource usage of processes or tasks running on system - the most notable resources being memory and CPU usage. top shows summary information for the system as a whole, and detailed information on individual tasks.
Most commonly top is run in live mode where it displays the summary info followed by details on the top N tasks, where N is determined by the remaining amount of display space, and "top N" is relative to a configurable sort order. In this mode top will refresh the display after a configurable delay.
In batch mode top displays the summary information followed by detail on all the tasks. Batch mode can be configured to do this X many times, with a Y second pause between each cycle. Each cycle is thus a snapshot of the state of the system at a given point in time, and a set of cycles can reveal changes through time. A system may have hundreds or thousands of processes in play, so the text based information gets pretty overwhelming for human interpretation.
If the output from batch mode is stored in a file, topplot can turn the information in to graphs.
In the following example, I set top to record my laptop's activity every second for five minutes. This produced a 65.3k line log file. Each of the 300 cycles looking something like the truncated version below:
top - 13:35:22 up 1 min,  0 users,  load average: 0.71, 0.47, 0.18
Tasks: 203 total,   1 running, 202 sleeping,   0 stopped,   0 zombie
%Cpu0  :  5.9 us,  5.9 sy,  0.0 ni, 88.2 id,  0.0 wa,  0.0 hi,  0.0 si,  0.0 st
%Cpu1  :  0.0 us,  0.0 sy,  0.0 ni,100.0 id,  0.0 wa,  0.0 hi,  0.0 si,  0.0 st
%Cpu2  :  5.6 us,  0.0 sy,  0.0 ni, 94.4 id,  0.0 wa,  0.0 hi,  0.0 si,  0.0 st
%Cpu3  :  0.0 us,  0.0 sy,  0.0 ni,100.0 id,  0.0 wa,  0.0 hi,  0.0 si,  0.0 st
MiB Mem :  15717.0 total,  13778.2 free,   1030.7 used,    908.1 buff/cache
MiB Swap:  15792.0 total,  15792.0 free,      0.0 used.  14327.6 avail Mem

  PID USER      PR  NI    VIRT    RES    SHR S  %CPU  %MEM     TIME+ P COMMAND
 2430 jonatha+  20   0    9164   3704   3120 R   6.2   0.0   0:00.02 0 top -bd 1 -n 300
    1 root      20   0  167036  10768   7800 S   0.0   0.1   0:01.33 3 /sbin/init
    2 root      20   0       0      0      0 S   0.0   0.0   0:00.00 3 [kthreadd]
    3 root       0 -20       0      0      0 I   0.0   0.0   0:00.00 0 [rcu_gp]
    4 root       0 -20       0      0      0 I   0.0   0.0   0:00.00 0 [rcu_par_gp]
    .
    .
    .
    .
    .
    .
------->8  snip 193 lines of process information
    .
    .
    .
    .
    .
    .
 2057 jonatha+  20   0  270244  35968  32508 S   0.0   0.2   0:00.04 2 /usr/bin/plasma-browser-integration-host /usr+
 2064 jonatha+  20   0  341308  38504  32424 S   0.0   0.2   0:00.07 2 /usr/lib/x86_64-linux-gnu/libexec/vvvvvvvvvvv
 2069 jonatha+  20   0    6640   3136   2888 S   0.0   0.0   0:00.00 3 /bin/bash /home/jonathansambrook/.config/wwww+
 2070 jonatha+  20   0  657204  43148  26504 S   0.0   0.3   0:00.18 3 /home/jonathansambrook/xxxxxxxxxxxxxxxx/yyyyy+
 2098 jonatha+  20   0 2414952  77112  54068 S   0.0   0.5   0:00.27 2 /opt/firefox/firefox-bin -contentproc -childI+
Remember, there are 300 of these to examine and spot patterns across.
topplot turns all that text based data in to this:
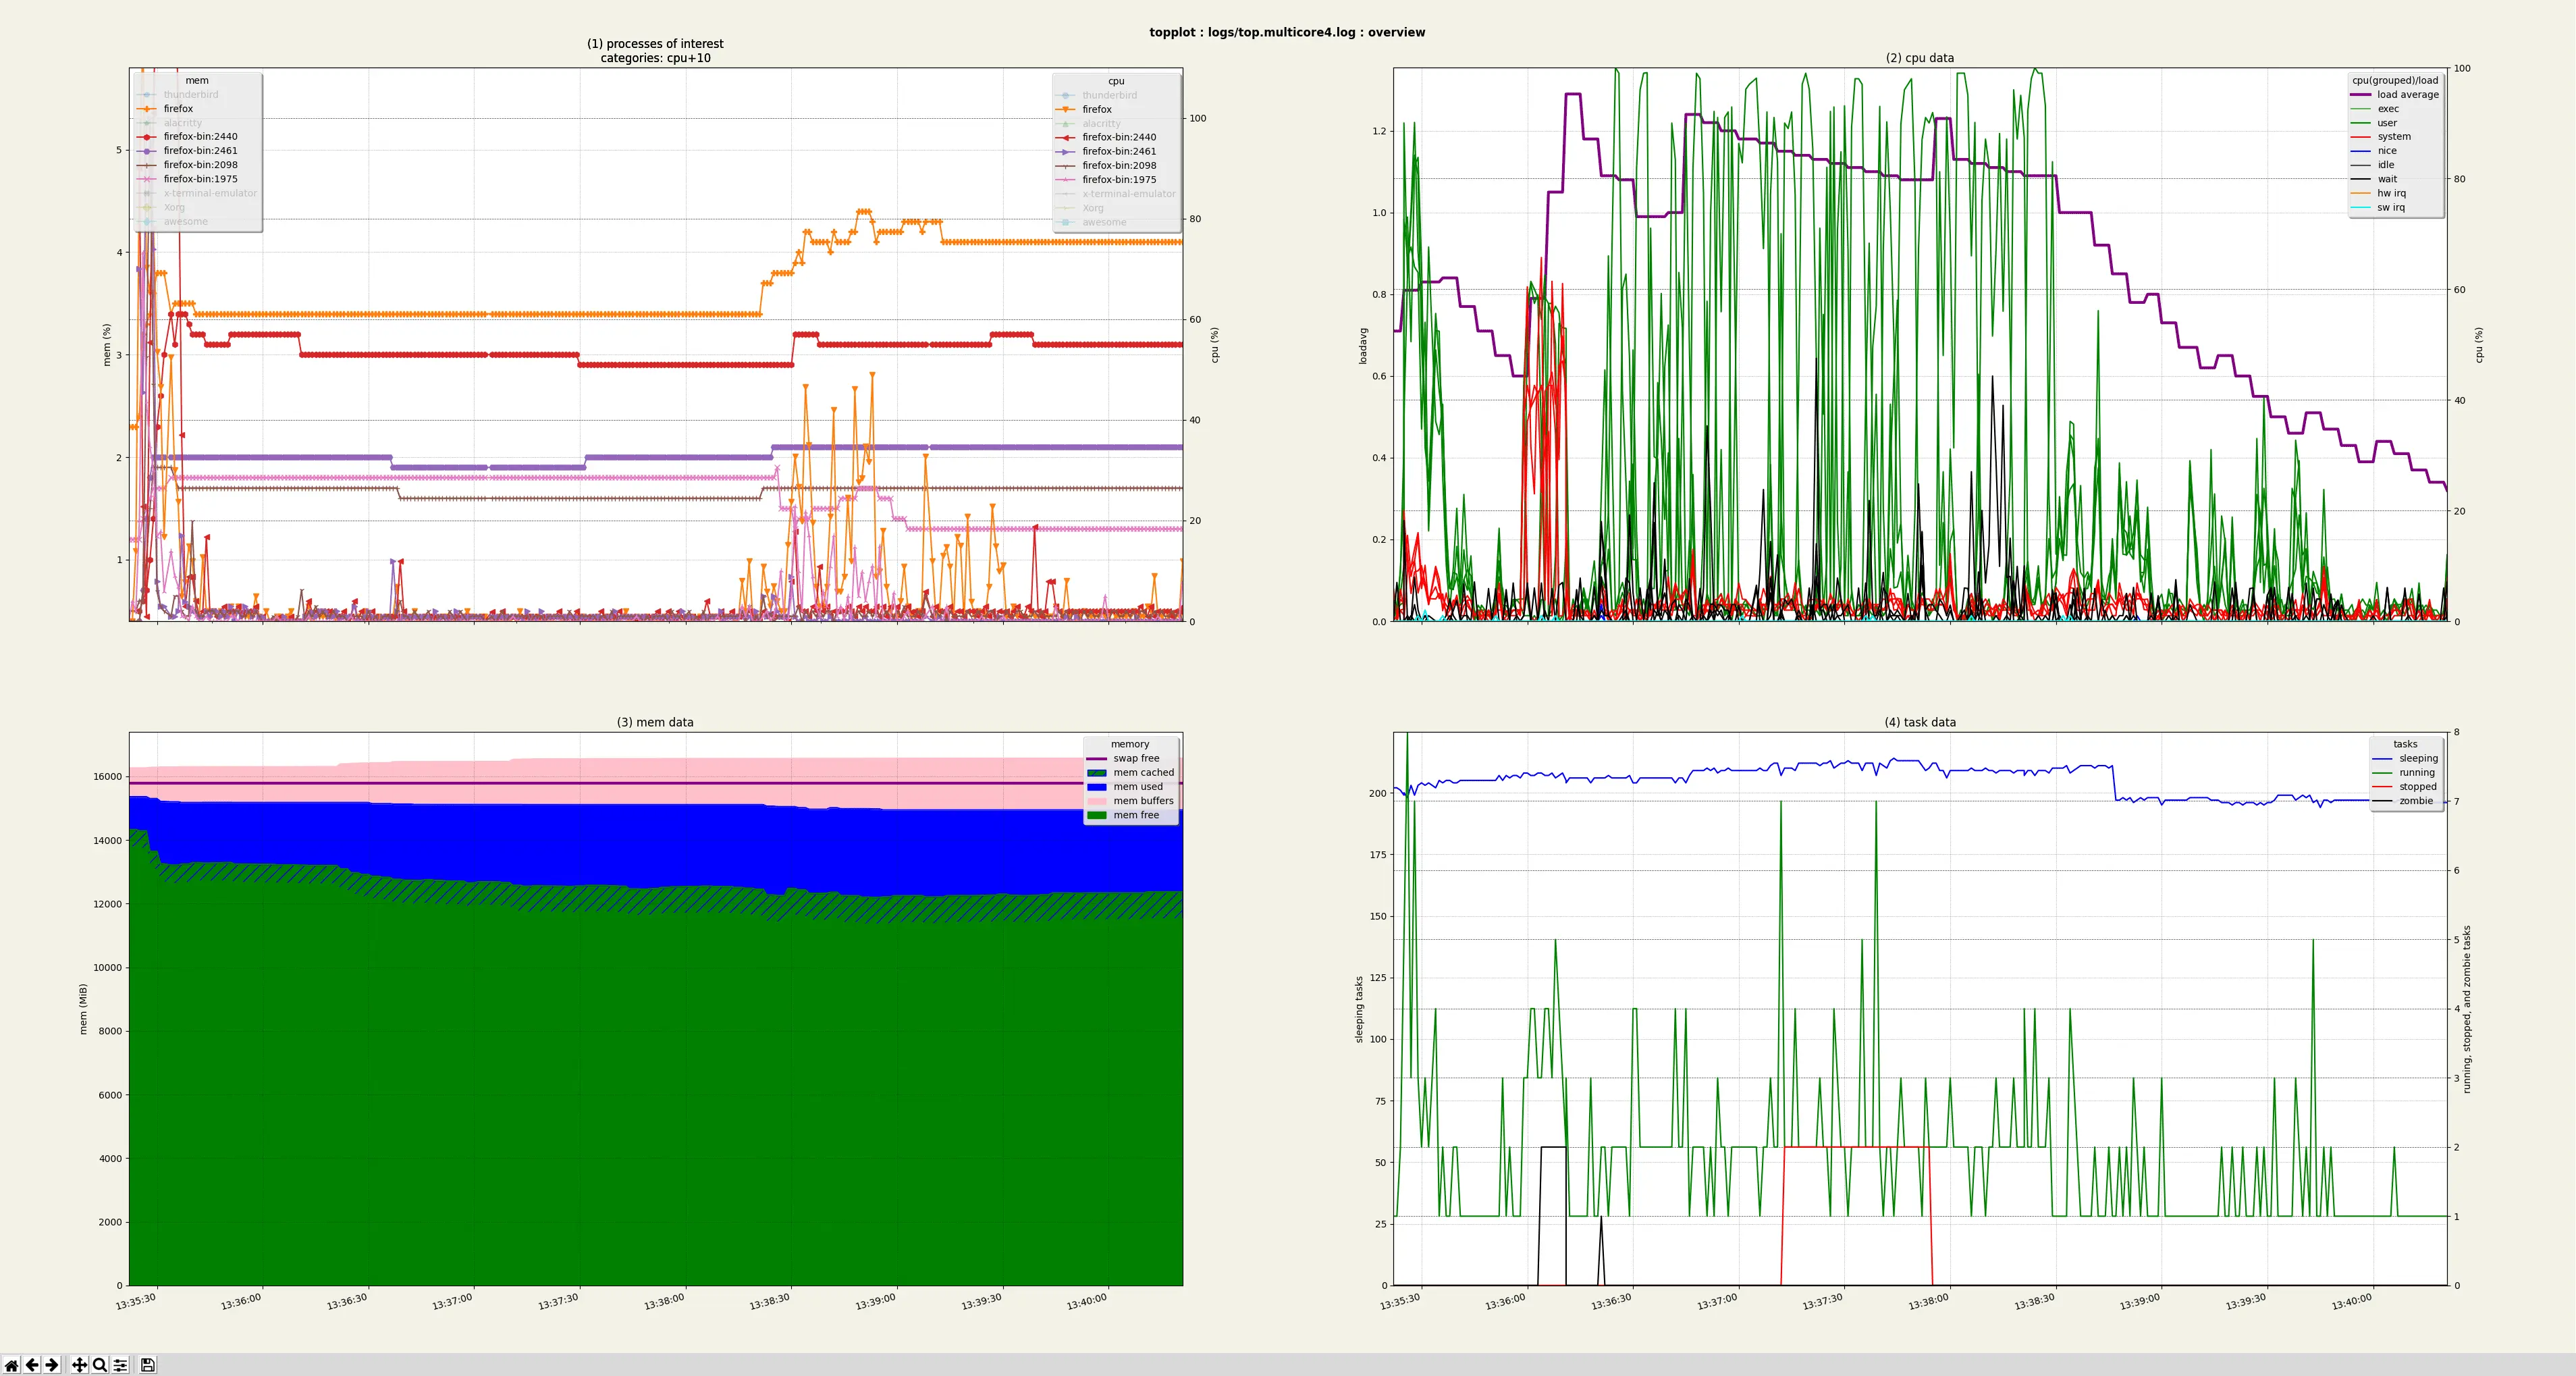
The top left graph shows memory and CPU usage for Processes of Interest (POI). Here I've gone with the default setting of the top ten processes ranked by accumulated CPU usage, but this is configuarable.
(I've toggled the displaying of lines belonging to non-Firefox processes by clicking their legend entries in order to demonstrate that feature.)
The other three graphs are derived from the system summary data.
topplot can also display and print these four graphs as separate figures, as well as figures displaying the Processes of Interest running on each CPU core, or the summary information for each CPU core.
Refactoring
topplot started out as a quick and dirty response to an immediate problem. As such it did the job for me, but was fiddly to set up, to use, and to extend. Over time I've morphed topplot in to something that's simple to install (assuming Python to already be installed on your system: pip install topplot), and much more capable and (I hope) useful. In its current form it is easier to maintain and extend than it has been, but it still needs more work in that direction.
Originally topplot was a small Bash script which processed the top data in to temporary files, then fed those files to the graphing tool Gnuplot. When coding in Bash became too onerous, I rewrote topplot as a Python script, albeit still controlling Gnuplot. (I use Bash a lot, but it certainly has its limitations and idiosyncrasies.) When using Gnuplot as a GUI became too restrictive, I swapped it out for the MatPlotLib graphing module.
Even after the move from Gnuplot to MatPlotLib, and thus it's no longer necessary to do so, the data is still being processed to temporary files. Would eliminating the use of temporary files will elicit any performance improvement?
Spoiler alert: the temporary files weren't causing the expected performance hit, and they're still in use - for now. But their days are numbered. Having the temporary files has occasionally been slightly useful for debugging purposes, but moving over to parsing the top data directly in to Pandas dataframes will open up the data manipulation options, and facilitate flexible interaction with the data.
In preparation for abandoning the use of temporary files, I needed to refactor the convoluted, monolithic data preparation code in to separate and tractable functions. This refactoring also lead to:
-
splitting out the code which handles the commandline arguments in to a separate classes
-
some fun reworking of the class which keeps track of the top N items for a given criterion
-
sundry other small improvements to the existing code
(As a side note: the sorting aspect of the TopNDict class reminds me about a great talk on optimizing sort algorithms, Andrei Alexandrescu's CppCon 2019 presentation “Speed Is Found In The Minds of People". Informative and surprisingly entertaining.)
Profiling
Once the code was split up in to discrete functions, profiling can ascertain what area of the code is taking longest to run.
For a bird's eye view of where time is being spent, I turned to a statistical profiler, py-spy. Statistical profilers don't keep an absolute account of a programme's activities, instead they take samples at predetermined intervals. Deterministic profilers create accurate accounts, but require much more invasive instumentation of the code. py-spy has the useful ability to produce interactive flamegraphs, and is simple to install and use:
1) pip3 install py-spy
2) py-spy record -o topplot.py-spy.svg -- ./topplot -f logs/top.multicore4.log -g0Q

This showed that the data parsing phase wasn't as significant as graph production. Looking at flamegraphs for figures of individual graphs indicated that CPU data graph was taking up a surprising amount of time, and this is backed up by deterministic profiling.
I chose to integrate yappi as a deterministic profiler since it's been actively tracking recent developments in Python and seems both capable and efficient.
In developing the profiling code, an extension to the existing commandline interface suggested itself that would be useful both when developing topplot and also in everyday use. Where previously the user could only specify a figure to open, they can now specify a sequence of actions such as:
1) open the Overview figure, the POI figure, and the CPU figure (by default only the Overview figure is opened) 2) save all three as PNG files 3) close all the figures
This eliminates the need to interact with the gui, simplifying the production of the PNG files, or, as shown next, the profiling process.
The new functionality allows the following usage to track down which graph is to blame:
for n in 1 2 3 4; do
    ./topplot -f logs/top.multicore4.log -g${n}q --profile
done

# Separate loops keeps the output cleaner

for n in 1 2 3 4; do
    f=yappi.top.multicore4_${n}q.graph.prof
    echo -e "-------------\n\n$f"
    head $f | grep App.produce_graphs
    echo
done
which emits:
-------------

yappi.top.multicore4_1q.graph.prof
..lot_/app.py:881 App.produce_graphs  1      0.000020  0.790158  0.790158

-------------

yappi.top.multicore4_2q.graph.prof
..lot_/app.py:881 App.produce_graphs  1      0.000018  3.826264  3.826264

-------------

yappi.top.multicore4_3q.graph.prof
..lot_/app.py:881 App.produce_graphs  1      0.000020  0.650636  0.650636

-------------

yappi.top.multicore4_4q.graph.prof
..lot_/app.py:881 App.produce_graphs  1      0.000020  0.552435  0.552435
Note the number of seconds indicated in the final column.
The numbers vary across runs of course, but more-or-less maintain these proportions.
With logs from a 12 core machine (up from 4 cores in the previous log file):
-------------

yappi.top.multicore12_1q.graph.prof
..lot_/app.py:878 App.produce_graphs  1      0.000226  0.829742  0.829742

-------------

yappi.top.multicore12_2q.graph.prof
..lot_/app.py:878 App.produce_graphs  1      0.000246  16.68642  16.68642

-------------

yappi.top.multicore12_3q.graph.prof
..lot_/app.py:878 App.produce_graphs  1      0.000257  0.607420  0.607420

-------------

yappi.top.multicore12_4q.graph.prof
..lot_/app.py:878 App.produce_graphs  1      0.000294  0.767467  0.767467
Quite clearly graph 2, the CPU data figure, is the problem's locus, so that's where I devoted my time, not in eliminating the innocent-in-this-regard temporary files.
I used kcachegrind to drill down and find out precisely where time is being spent, hypothesize a fix, and test it out.
So, topplot wasn't getting bogged down where I had assumed it would be. This is an immediate win - don't waste effort on optimizing the wrong things.
Instead I identified the real culprit, and constrained the feature which triggers the extra processing so that the user has to deliberately ask for it to be engaged.
Static analysis and simple CI
While I had some time to spend working on topplot, I wanted not only to improve the structure of the code, and add a couple of new features, but I wanted to also embed some good development practices.
To this end I'm using GitLab's CI system to run code formatting (Black) and static analysis tools (pylint, flake8, and mypy (not yet fully integrated)). This has turned out to be another immediate win: amongst a whole host of issues which the tools hold strong opinions on, running linters on the codebase unearthed a couple of hidden bugs.
After fixing the bugs and addressing most of the other issues, I've configured the linters to ignore certain classes of issue. Some, such as the warnings of missing documentation, I'm aware of, but don't want to focus on at this point - I'm writing documentation for new code elements, but documenting the existing codebase is a job of work in itself. Others issues I'm happy to permanently ignore - either they're not relevant to topplot, or most amusingly they clash with the opinions embedded in one of the other tools!
The codebase has benefitted from being reviewed in this manner, and the CI will help keep an eye on things from here on.
Rinse and Repeat
The above looks like a linear process, but during the refactoring, profiling / optimization, and static analysis phases, other refactoring possibilities jumped out at me.
For example, when modifying the figure level graphing code I found myself having to make the same change in several places - a classic indicator that there's an abstraction opportunity being missed. So now that section of the codebase is cleaner, with fewer lines of code and less scope to introduce mistakes. Adding the same feature to a different figure was a snap, and if a new figure is ever to be added, it's much clearer how this is to be done.
There's also the fresh eyes effect of coming back to the code after working on other projects - "why on earth did I do that when it's obvious it should be done like this?" :)
Issue tracking
I've also started making use of another GitLab facility: Issue tracking. This isn't rocket science, but as an aid to work flow, even on a small project, it is a boon. When an idea occurs as I'm working, I can quickly raise an issue so that I don't forget it, but then get straight back to the matter at hand.
What's next?
Tests
With the data parsing code refactored in to discrete functions, I'd like to get unit tests implemented for that part of the codebase. (Automated CI testing the GUI is a more complicated proposition!)
However, parsing straight to Pandas dataframes will significantly disrupt the programme's implementation, so adding unit tests before that work is at least under way doesn't make any sense.
A recent bug would've been caught by running the code against all of the top log files I've accumulated. I've now modified the Makefile used to build and upload the binaries sent to PyPi so that it can check that the top logs are all handled safely. Some of these log files are from a customer, and can't be commit to the repo, so another task will be to generate valid test cases which can be committed.
Android (Toybox/Busybox)
I'd like to have toplot handle the version of top used on Android. This is provided by the Busybox fork, Toybox. I know that Toybox's top doesn't emit a timestamp, and I'd guess that Busybox's top is similar or the same. This means that topplot will have to fake a timestamp on their behalf. Whilst this work is reasonably urgent, it's best left until after the parsing changes are implemented.
Interactive querying
Currently the user has to specify which processes are of interest, and other such parameters, on the commandline. When the data is parsed to Pandas dataframes, the querying can happen at a much later point, and since the full dataset can be retained, requerying becomes a possibility.
Other Content
- Assessing the reproducibility workflow in freedesktop-sdk
- Deep Dive into Upstream RISC-V Boot Chain
- Porting an Automotive Operating System to RISC-V
- Understanding Codethink's IEC 61508 Mapping for the Eclipse Trustable Software Framework
- Resisting Hyrum's Law with Private Constructors in Python
- FOSDEM 2026
- Building on STPA: How TSF and RAFIA can uncover misbehaviours in complex software integration
- Adding big‑endian support to CVA6 RISC‑V FPGA processor
- Bringing up a new distro for the CVA6 RISC‑V FPGA processor
- Externally verifying Linux deadline scheduling with reproducible embedded Rust
- Engineering Trust: Formulating Continuous Compliance for Open Source
- Why Renting Software Is a Dangerous Game
- Linux vs. QNX in Safety-Critical Systems: A Pragmatic View
- Is Rust ready for safety related applications?
- The open projects rethinking safety culture
- RISC-V Summit Europe 2025: What to Expect from Codethink
- Cyber Resilience Act (CRA): What You Need to Know
- Podcast: Embedded Insiders with John Ellis
- To boldly big-endian where no one has big-endianded before
- How Continuous Testing Helps OEMs Navigate UNECE R155/156
- Codethink’s Insights and Highlights from FOSDEM 2025
- CES 2025 Roundup: Codethink's Highlights from Las Vegas
- FOSDEM 2025: What to Expect from Codethink
- Codethink/Arm White Paper: Arm STLs at Runtime on Linux
- Speed Up Embedded Software Testing with QEMU
- Open Source Summit Europe (OSSEU) 2024
- Watch: Real-time Scheduling Fault Simulation
- Improving systemd’s integration testing infrastructure (part 2)
- Meet the Team: Laurence Urhegyi
- A new way to develop on Linux - Part II
- Shaping the future of GNOME: GUADEC 2024
- Developing a cryptographically secure bootloader for RISC-V in Rust
- Meet the Team: Philip Martin
- Improving systemd’s integration testing infrastructure (part 1)
- A new way to develop on Linux
- RISC-V Summit Europe 2024
- Safety Frontier: A Retrospective on ELISA
- Codethink sponsors Outreachy
- The Linux kernel is a CNA - so what?
- GNOME OS + systemd-sysupdate
- Codethink has achieved ISO 9001:2015 accreditation
- Outreachy internship: Improving end-to-end testing for GNOME
- Lessons learnt from building a distributed system in Rust
- FOSDEM 2024
- QAnvas and QAD: Streamlining UI Testing for Embedded Systems
- Outreachy: Supporting the open source community through mentorship programmes
- Using Git LFS and fast-import together
- Testing in a Box: Streamlining Embedded Systems Testing
- SDV Europe: What Codethink has planned
- How do Hardware Security Modules impact the automotive sector? The final blog in a three part discussion
- How do Hardware Security Modules impact the automotive sector? Part two of a three part discussion
- How do Hardware Security Modules impact the automotive sector? Part one of a three part discussion
- Automated Kernel Testing on RISC-V Hardware
- Automated end-to-end testing for Android Automotive on Hardware
- GUADEC 2023
- Embedded Open Source Summit 2023
- Full archive